A star is classified by
luminosity and color.
luminosity is measure in
magnitudes and color is
measured by temperature. Edward Pickering and Willimina Fleming and a group of women (one of these
women, Henrietta Leavitt, discovered the
Cepheid
variable star - important in distance measurements)
cataloged thousands of stars according to spectra.
While all the this number data was fine, it was two
astronomers (working separately) that discovered a
correlation to a stars spectra and
brightness. Ejnar
Hertzsprung and Henry Norris Russell created a plot
of the stars and created what is now called the
Hertzsprung-Russell diagram. We will look at this
diagram later.
While our observations can
determine
luminosity and spectral classes, close
observation and study of
binary stars can also yield mass.
While stars are just point sources
far from
Earth, there is still much we can learn.
For example, if the star is relatively close to us,
we can determine its distance using stellar
parallax:
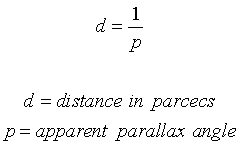
By measuring the shift angle seen
from
Earth, we can determine distance. In case you
don't know what
parallax is, hold a pen or pencil
arms length from your face and close one eye at a
time while looking at something far away. The
shifting of the pen is the
parallax.
We can also determine the
brightness of a star (as well as its
luminosity) if we know its
distance. We can use the Inverse Square Law:
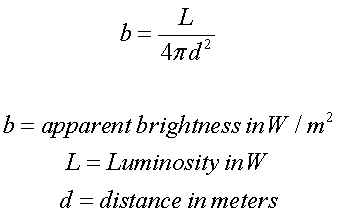
However, notice that we need to know
the
luminosity of the star to determine
brightness.
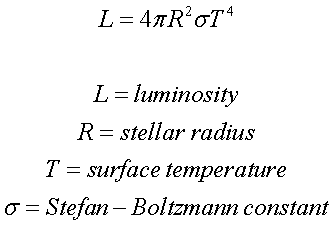
We can determine the
luminosity of the star using
this formula:
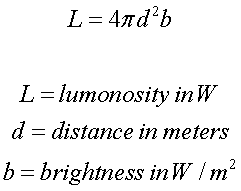
but without knowing
brightness, it
seems we cannot determine
luminosity. This is where
our
Sun comes in. We have the benefit of a
frame of reference when comparing to other stars.
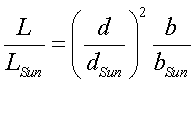
With the known values in place, its
just a matter of some
algebra.
Another classification for stars is
magnitude - how bright does the star appear to us on
Earth. There are two versions of
magnitude:
The
magnitude scale is graded by
numbers: 0 being bright, 6 being dim. Some values of
comparison:
The
magnitude scale works out to be
logarithmic, and the difference between each value
is 2.512. That is
magnitude 1 is 2.512 times
brighter than
magnitude 2 and
magnitude 5 is 2.512 *
2.512 * 2.512 times dimmer that
magnitude 2.
By knowing the distance and apparent
magnitude to a star, we can learn the absolute
magnitude. Also, if we happen to know the absolute
magnitude, we can determine distance. The result of
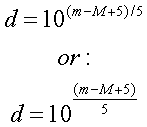
this is the distance modulus:

or:
By using filters (blue, green, red)
and measuring the
brightness of a star in the
different filters, we can determine the color index
of a star (and recall from the physics section that
color and temperature go hand in hand):

If the B-V value is 1, the star is
white. If the B-V index is less than 1, the star is
more blue and if the B-V index is more than 1, the
star is more red.
All of these tools led to a
correlation: a stars size relates to how bright it
and how hot it is.
It is this correlation that helped
to create the Hertzsprung-Russell (or H-R) diagram:
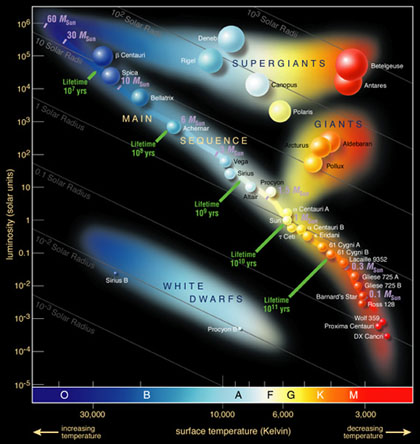
(Image Credit: Pearson Education, Addison Wesley)
Going back to
luminosity, there are
six classes of
luminosity:
- Ia - Bright Supergiant Stars (example: Deneb)
- Ib - Supergiants (example: Antares)
- II - Bright Giants (example: Canopus)
- III - Giants (example: Capella)
- IV - Subgiants (example: Beta Cru)
- V - Main Sequence (example: Vega)
Classes can be categorized like: Ia, Ib, Ic, IIa,
IIb, IIc, and so on (sub-a being brighter that
sub-b).
In addition, notice the x-axis of the H-R
diagram. This is the spectral class - the result of
the Harvard team.
- O - O type stars are the brightest and the
live the shortest
- B - B type stars are blue white and also
burn bright, but not as bright as the O type
- A - A type stars are less bright, a little
larger than our
Sun, but still burn hotter
- F - Brighter than our
Sun and a little
hotter
- G - Our
Sun is a G type star
- K - dimmer that our
Sun, will burn
longer because temperature is lower
- M - the dimmest stars, will burn for a long
time

(Image Credit: Pearson Education, Addison Wesley)
The famous pneumonic helps astronomers remember
this sequence: Oh Be A Fine
Girl (or Guy) and Kiss Me.
Who says scientists don't have a sense of humor?
One final interesting formula: a quick and dirty
correlation between a stars
luminosity and
magnitude
is:

All that is left is to determine the mass of a
star. We now know that bright stars are very large
and dim stars are small, but without an accurate
measure of mass, we can only speculate. This is
where binary stars come into play.
Back to Top
A binary star is a multiple star system bound by
mutual gravitation. Both stars will revolve about a
common point. You can find out more by requesting astronomy homework help from a real astronomer. By using
Keplerian math, we can
determine the mass by studying this movement. If we
know the spectral class of the stars in question, we
can assign standardized values (like the H-R
diagram) that will give is the mass of all stars.
There are four main classes of binary stars:
- Visual binary stars - stars that we see on
Earth as being binary
- Spectroscopic binaries - binary stars that
are only seen using spectroscopy
- Eclipsing binaries - binary stars at our
line of sight
- Accreting binaries - close pairs that "feed"
off each other
A visual binary star system can either be a real
binary, or one that looks that way because of our
view on
Earth. A true binary will move something
like this:
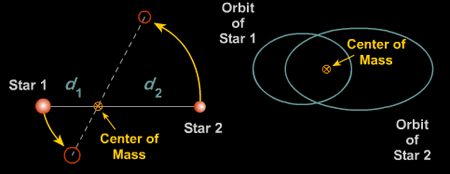
(Image credit: Brooks/Cole Thomson Learning)
In order to find the mass of a visual binary:
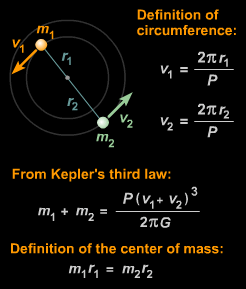
(Image credit: Brooks/Cole Thomson Learning)
m in this case is mass and P is the period of the
orbit.
A
spectroscopic binary star is one that is not
seen visually, but long term observation records a
shift in the stars spectrum:

(Image credit: Brooks/Cole Thomson Learning)
Sometimes if the orbit of the binary star is
facing us, we may not be able to see
spectroscopic
changes, but we will see
brightness changes. Long
term observation will reveal periodic changes in
overall
brightness:
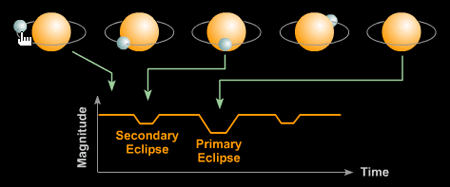
(Image credit: Brooks/Cole Thomson Learning)
This same technique is used for the
detection of
exoplanets.
The final class of binary star is the accreting
binary. If the pair of stars are close enough, the
atmosphere of one star can pour onto another. The
point of no return in this case is the outer
Lagrange point (not seen in the image). If material
breaches the outer Lagrange point and contacts the
inner Lagrange point, material will begin to flow
onto another (that is what I mean by the point of no
return).
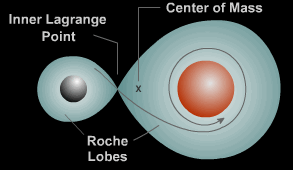
(Image credit: Brooks/Cole Thomson Learning)
A common companion star to an accreting binary
system is a neutron star or a white dwarf - both
covered in
stellar evolution. Some final
bits: binary star system are actually quite common -
Sir William Herschel discovered 10,000 binary star
systems. In addition, binary stars are really part
of multi-star systems. Many stars have more than one
companion. A triple star system is also common.
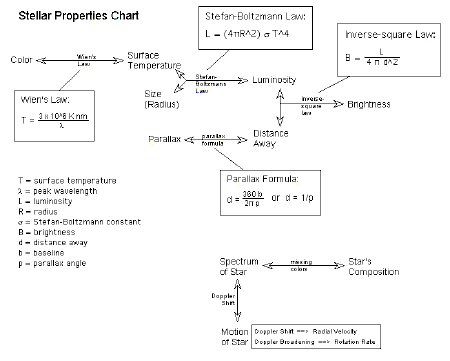
To sum up, here is a nice chart I found that
demonstrates the process of stellar classification:
(Image
Credit)
Back to Top |

