Spectroscopy is second to
photography with regards
to importance. It was the
photography of spectra
that birthed Astrophysics.The term spectra is
defined as the entire
electro-magnetic wavelength.
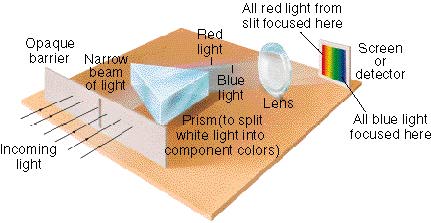
Spectroscopy began in 1666 when Sir Isaac Newton
discovered that white
light passing through a glass
prism split the
light into a rainbow. To confirm
this, Newton passed the rainbow through another
prism and it recombined into white
light.
Spectroscopy took off in the 19th century when
Joseph Fraunhofer took a spectra of the
Sun and
noticed dark lines in the spectra

In 1857, Gustav Kirchhoff and Robert Bunsen
experimented with laboratory chemical spectra and
determined that each chemical element has its own
unique spectral signature - called spectral lines.
Furthermore, Kirchhoff summarized the three
important elements of spectra, called Kirchhoff's
Laws. To understand the laws, it is important to
understand the concept of a "blackbody." This is not
an object that is black or dark, instead a blackbody
is a theoretical object that emits all
light and
radiation that is directed to it. If 100% of
light were to illuminate a blackbody, 100% of that
light will be emanated. Kirchhoffs Laws
(three of them): 1. A blackbody
process a continuous spectrum, free of any
spectral lines.
2. A hot, transparent gas will produce emission
lines - a series of bright lines against a dark
background.
3. A cool transparent gas in front of a blackbody
will produce absorption lines - dark lines on
a spectra that would appear in the same place as a
hot gas cloud comprised of the same elements.
Astronomers study the spectra of
stars and
galaxies
based on these three laws, but do not use a prism in
their spectroscopy equipment. Astronomical
spectrometers use what is called diffraction
grating. There are three main components to a
spectrometer:
-
The slit - only a small section
of
light is required for a spectral analysis.
This also helps remove any stray
light.
-
The collimator and diffraction
grating - the collimator focuses the
light onto
the diffraction grating where
light is split
into its fundamental colors.
-
Camera lens or
CCD detector -
the reflected spectra is then captured on film
or
CCD for analysis.
A diffraction grating is nothing
more than a special cut glass plate with small lines
etched into the glass. The more accurate and more
numerous the cuts, the more accurate the spectra.
The reason gratings are used instead of prisms is
that the grating can be adjusted and the prism
cannot. The prism of a spectroscope must have 60
degree angles and cannot be rotated.
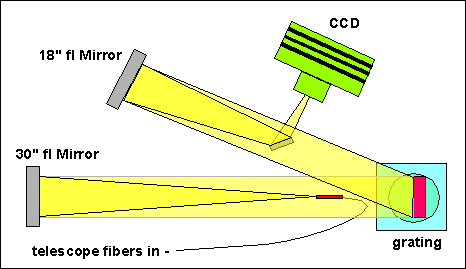
The image above is from the
Spectrashift.com group of amateur astronomers
using this style of spectroscope to capture the
radial velocity of a
stars wobble as a result of an
exoplanet. The image below shows the
Fraunhofer spectra, complete with the brightest
Fraunhofer lines (shown by letters of the alphabet).
This image also shows the frequencies of each color.
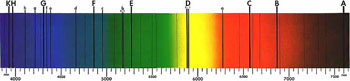
Image Credit - and additional information.
Back to Top |
