As we have already discovered in the introduction,
the evolution of a star can be a complicated
subject. Luckily there is a way to sort through this
and create some guidelines.All stars produce
their energy via nuclear fusion,

and there are two
major categories of stars:
- Low mass stars - like our
Sun
- High mass stars - like the large supergiants
Both categories of stars may begin the same, but
their ends are dramatically different. A low mass
star is any star that is less than 2.2 Solar masses.
Any star that has more mass than 2.2 Solar masses is
a high mass star.
We have already introduced the concept of
Jeans
Mass and
Jeans Length that places restrictions on
the size of cloud prior to collapse. Now the overall
mass of the cloud being contracted will dictate the
soon-to-be stars place on the Main-Sequence.
A Hertzsprung-Russell diagram is probably one of
the most powerful tools an Astronomer can have.
Pioneered by Elnar Hertzsprung and Henry Norris
Russell, the diagram demonstrated the relationship
between
luminosity and radius:

The result is a graphical
representation of what we know about stars:
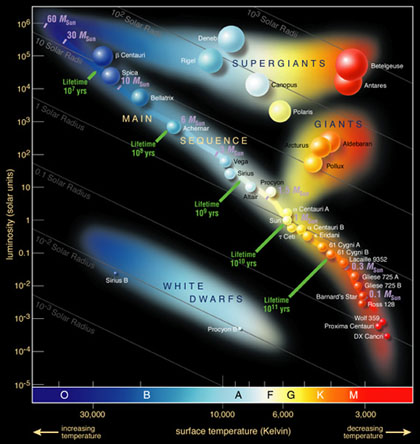
(Image Credit: Pearson Education, Addison Wesley)
The diagram demonstrates that normal
stars like our
Sun exist on what is called the Main
Sequence. Other stars populate other areas based on
the energy they produce and their
luminosity.
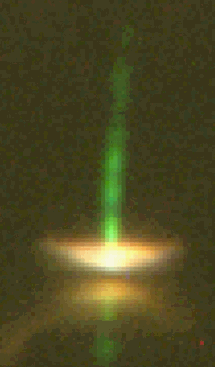 |
But before we look at fully formed
stars, we have to examine the early history
of proto-stars. The image on the left
shows a molecular cloud that has collapsed
to the point that a central proto-star is
now producing some heat and energy, not
enough to fuse hydrogen
atoms, but enough to
flatten the cloud and eject disk material
(the green trail) away from the cloud.
Once material is ejected, the angular
rotation of the cloud as a whole begins to
slow and angular momentum is lost, but the
energy must go somewhere. The shape of the
lighted part of the disk demonstrates where |
some of this energy goes as magnetic bands form
close to the star. The energy from the rotation is
now being transferred via magnetic lines. However,
the heat of the proto-star continues to rise.
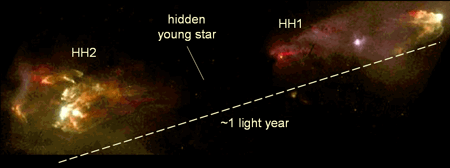
Image Credit
High speed jets create interstellar
shock waves like the image above. This is called a
Herbig-Haro object. The effect is the result of
ionized oxygen and carbon. The winds creating these
objects can be anywhere between 20 km/s to almost
500 km/s.
The name of the central object
during these stages changes from proto-star to Young Stellar
Object. While the jets continue to expel disk
material, the Young Stellar Object (YSO) becomes
visible and the name changes again to a T-Tauri
star. This stage continues until hydrogen fusion
initiates.
The point of separation between low
mass and high mass stars is in the mass of the cloud
itself. By studying groups of YSO's and T-Tauri
stars, Astronomers have been able to theorize
positions that new stars take on the
Hertzsprung-Russell diagram (hereafter known as the
H-R diagram). The Hayashi Track, named after
Chushiro Hayashi after extensive work in stellar
evolution, demonstrates where a T-Tauri star will
enter the Main Sequence.
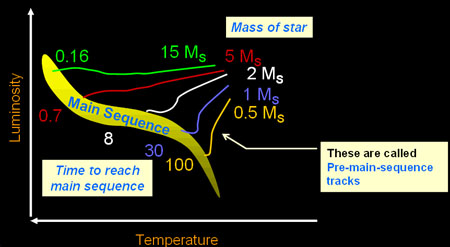
Image Credit
A more detailed look at the
evolutionary tracks:

(Image credit: Brooks/Cole Thomson Learning)
| This timeline demonstrates
the mass
limit of the YSO's. You may notice from the
chart that larger mass YSO's
enter the main sequence must faster than
lower mass stars. This factor is present in
the lifetime of these stars as well.
Basically, large stars: "Live fast and die
young." |
| Solar Mass: |
Time
(million years): |
| 0.5 |
100 |
| 1 |
30 |
| 2 |
8 |
| 5 |
0.7 |
| 15 |
0.16 |
|
Of special note, the point the star
enters the Main Sequence, it is called a Zero Age
Main Sequence star, or ZAMS.
Our stars have now entered the Main
Sequence phase. Nuclear fusion has begun in the core
of the star and is radiating and/or convecting its
energy to the surface atmosphere.
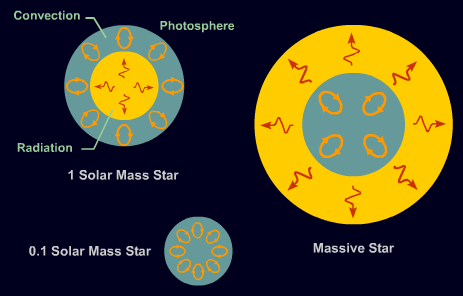
(Image credit: Brooks/Cole Thomson Learning)
As far as the interior energy transport, the
differences are a bit different:
- The energy transport mechanism of radiation
is present in stars between 0.8 and 1.2 Solar
masses
- Stars less than 0.8 (Brown Dwarfs, YSO's, T-Tauri)
have convecting cores
- All other stars show the pattern of energy
transport as the massive star in the above image
Once on the Main Sequence, both low mass and high
mass stars create their energy through the
Proton-Proton Chain.
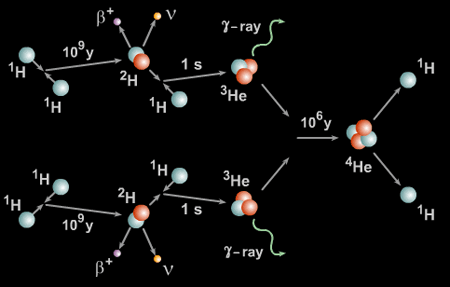
(Image credit: Brooks/Cole Thomson Learning)
It takes awhile for some of this reaction to take
place, and as a result has quite a bit of time
before expending the core hydrogen.
Stellar Lifetimes Based on Spectral Class:
| Spectral Class: |
Solar Masses: |
Solar Luminosity: |
Temperature: |
Solar Radii |
Time on Main
Sequence (million years): |
| O5 |
40 |
400,000 |
40,000 K |
13 |
1.0 |
| B0 |
15 |
13,000 |
28,000 K |
4.9 |
11 |
| A0 |
3.5 |
80 |
10,000 K |
3.0 |
440 |
| F0 |
1.7 |
6.4 |
7,500 K |
1.5 |
2,700 |
| G0 |
1.1 |
1.4 |
6,000 K |
1.1 |
8,000 |
| K0 |
0.8 |
0.46 |
5,000 K |
0.9 |
17,000 |
| M0 |
0.5 |
0.08 |
3,500 K |
0.8 |
56,000 |
Notice how the O type star resides on the Main
Sequence for only a million years compared to a star
like our
Sun.
Once a star initiates shell hydrogen burning,
this marks the Main-Sequence Turnoff Point. At this
point, low mass and high mass stars evolve a bit
different.
Back
to Top |

