I will be blunt: I am not a big fan of statistics.
As a matter of fact, of all the science related
courses I have taken, Statistics was (and is) my
Achilles Heel.Statistics is basically the
collection of empirical data used to generate
probability. Data is collected, including random
errors, and distributions plots are generated. These
plots provide probability of a given event.
We see statistics on an almost daily basis:
weather reports, stock market reports, and Monday
mornings (call in sick or not - probability based on
weather or feelings towards work in general).
We have also heard of statistics in airline
safety - its safer to fly than to drives since the
occurrences of plane crashes is far less than
automobile crashes.
This is all based on Statistics. By using data
plots, the sum of events can be observed.
Probability is another form of statistics that is
based on experimentation and outcomes.
Statistics:
Probability:
Statistics:
In order to generate plots, a data set
must be gathered. The data set is a series of
observations ordered by class - for
example, test grades from 6 different courses, each
course is a class and each grade is an
observation.
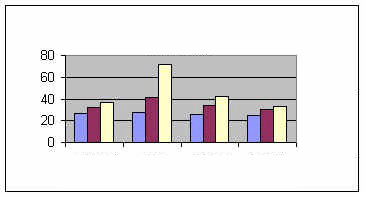
The image above is an example of a bar graph. This
is also called a histogram. To center
the data, we can use mean, median, and
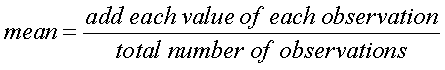
mode. The mean:
The median: Arrange the data in order.
For example, your grades are 60, 62, 58, 75, 99, and
47, the order will be: 47, 58, 60,
62, 75, and 99 The mean is between
60 and 62, so its 61. Another
example: 10, 100, 5000, 1000000,
5000000000 (the latter two are one million and five
billion) The median is 5000
The mode:
Any value that appears more than once will be the
mode. There are no duplicate values in the grades
above, so there is no mode for this data set. If the
grades were: 47, 58, 60, 75, 75,
and 99 The mode will be 75.
The histogram created will generate a curved plot.
| A natural bell shape to a histogram
is said to have a normal distribution.
The area that is spread out is called the
standard deviation. The numbers along
the axis are called z-scores. |
 |
If a value does not fall on a
z-score line, the unknown z-score can be determined
by:
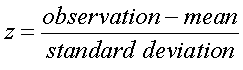
For an unknown observation value:
 Back
to Top
Probability:
In order to study uncertain events, we use
probability. There are four steps involved:
-
Experiment - actions that cannot
be predicted
-
Outcomes - possible results
-
Sample Space - collection of all
possible outcomes
-
Event - sub-collection of the
sample space
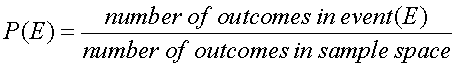
The result P(E) can be 0 or 1 or anything in
between. P(E) = 0 means the event (E)
will never occur
P(E) = 1 means the event (E) will always occur Back
to Top |
