Radio waves are the longest wavelengths, shortest
frequencies, and the lowest energy of the
EM-band.
Astronomers using radio to study phenomenon use a
frequency range of 300GHz to 30MHz.The
wavelengths of radio waves are very large, and as a
result large dishes are required to "capture" them.
Because radio is of a lower energy than visible
light, radio waves can reflect off of non-reflective
surfaces. As a matter of fact, a disk does not have
to be completely solid since the waves are so large.
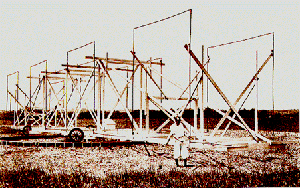 |
In 1931, Karl Jansky was tasked by Bell
Telephone Labs to determine the cause of
static over long distance telephone lines.
He built a device in an attempt to pick up
stray radio waves. |
Instead, by 1933 he realized the emission was
coming from space along the path of the
Milky Way
galaxy. By 1935, the first radio disk was
constructed by Grote Reber, and radio astronomy was
born.
While radio astronomy is used to study a wide variety of topics, the most common use is
the mapping of hydrogen emission. Such emissions
allowed for the determination of the spiral
structure of our galaxy - using Doppler shift.
Hydrogen is the most abundant element in the
Universe. It exists scattered throughout the
Universe as well as members of larger clouds of dust
and gas within
galaxies. The hydrogen atom consists
of 1 proton and 1 electron, and exist in one of
two states: aligned or opposed:
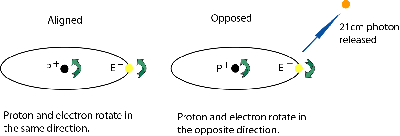
The rotation (spin) of the electron can spontaneously shift
to the opposite direction releasing a
photon. This energy is
detected at 21cm, or 1.42GHz (1420MHz). This
shifting occurs about every 400 years for a single hydrogen atom, but is
detected often due to the abundance of hydrogen.
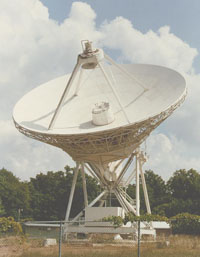
| The radio dish is the tool used by
astronomers to study this region of the
radio spectrum. Generally the larger the
dish the better, but more novel approaches
have been used to create a virtual dish by
creating a large array of radio dishes like
those at the
VLA in Socorro New Mexico. Even radio
dishes from other countries are tied
together creating the
Very Long Baseline Array - or VLBI. The image on the right is a dish called a Cassegrain, just
like the
telescope. The radio wave bounces
off the big dish, to the secondary dish at
the top, then through the center to the
radio gear at the base of the tower. |
 |
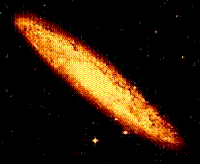
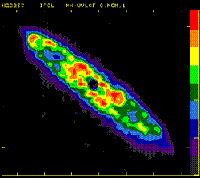
So what does a radio image look like? Just a
bunch of numbers really. Astronomers apply their
collected data and plot them based on intensity and
assigning them a color. These images of spiral
galaxy
NGC253 are a good example:
 |
 |
| This is an optical image. |
This is the radio
"image." |
The red on the radio image indicates higher levels of 21cm emission
while the violet indicates the lowest levels.
Strange really since the opposite holds true for
stars - red
stars are cooler than blue
stars, so be
careful with the details.
Back to Top |

