AstronomyOnline.org
home observation science solar system stars our galaxy cosmology astrobiology exoplanets astrophotography
Science
icon Introduction
icon Astronomy Tools
Concepts
1. Electromagnetic Spectrum
2. Atmosphere Limitations
3. Space Observations
Equipment
1. Telescopes
2. Radio
3. Space Tools
4. Photography
5. Spectroscopy
6. Computers
7. Advanced Methods
8. Radio Astronomy
icon Basic Mathematics
Algebra
Statistics
Geometry
Scientific Notation
Log Scales
Calculus
icon Physics
Concepts
- Basic Units of Measure
- Mass & Density
- Temperature
- Velocity & Acceleration
- Force, Pressure & Energy
- Atoms
- Quantum Physics
- Nature of Light
Formulas
- Brightness
- Cepheid Rulers
- Distance
- Doppler Shift
- Frequency & Wavelength
- Hubble's Law
- Inverse Square Law
- Kinetic Energy
- Luminosity
- Magnitudes
- Convert Mass to Energy
- Kepler & Newton - Orbits
- Parallax
- Planck's Law
- Relativistic Redshift
- Relativity
- Schwarzschild Radius 
- Synodic & Sidereal Periods
- Sidereal Time
- Small Angle Formula
- Stellar Properties 
- Stephan-Boltzmann Law
- Telescope Related
- Temperature
- Tidal Forces
- Wien's Law
Constants
icon Computer Models
icon Additional Resources
1. Advanced Topics
2. Guest Contributions
Basic Mathematics - Log Scales

A logarithm is an exponent (power) to which a base number must be raised to yield the same result. The standard logarithm scale is called base 10. The term "log" is used when specifying a log scale.

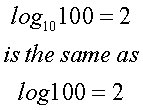
In base 10, the log of 100 = 2:

When basing your equation on base 10, indicating the base is not required as base 10 is implied:
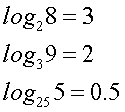
Other bases can be used, such as base 2, or base 3, or even base 25:
The reason for using a log scale is so we can evaluate our data easier. For example, a chart of data can either look like a boring straight line, or with a log system applied, a more dynamic chart is created:
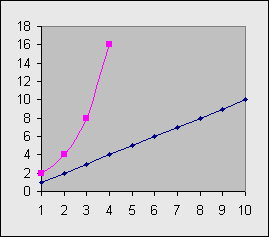
The graph above is nothing in particular, but the blue line will be raw data, and the pink line will be the same data using a base 10 log scale.

A perfect example of logarithm used in Astronomy is the Hertzsprung-Russell diagram, a diagram of stars.
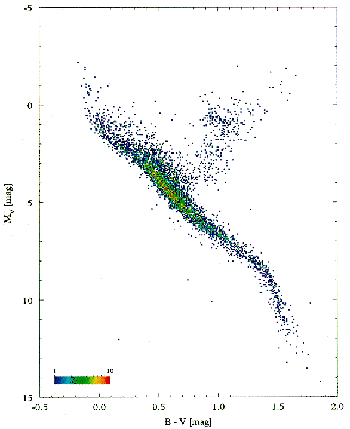
This diagram is an example of a Hertzsprung-Russell Diagram (H-R diagram). Astronomers already have the data in log form, so an example of an H-R diagram with just raw data only is hard to find, but the dots will reside in the lower half of the graph and the curves will not be apparent.

Back to Top


Search | Site Map | Appendix
©2004 - 2024 Astronomy Online. All rights reserved. Contact Us. Legal. Creative Commons License
The works within is licensed under a Creative Commons Attribution-ShareAlike 3.0 Unported License.