| In this section, we will discuss
some of the more prominent features of the Sun. And
we will also discuss the
Solar
Eclipse (found on its own page).
Here is a nice summary of some of
the important features. Just click on the
image to see a large version. The layers in this
image is not to scale.
We have already briefly covered the three outer
layers of the Sun, so lets visit each layer with a
bit more detail - working inward.
| Corona |
This outer layer is very dim - a million
times dimmer than the photosphere and oddly
enough, it is the hottest. At 106
K it would
seem the heat would be unbearable for us,
but remember in
Physics heat is a measure of
molecular
energy - the movement of molecules
within a space. Because the Corona extends
several million kilometers into space, there
is a lot of room for molecules to move. It
is this movement that is the source of the
solar winds. The high
temperature of the
Corona can force ions to move as fast as a
million kilometers per hour. |
| Chromosphere |
Chromosphere means "sphere of color,"
but this layer is 10-4 as dense
as the photosphere so it is not that bright.
In fact, the best way to view the
chromosphere it to use a special narrow band
filter called a Hydrogen-Alpha (Hα)
filter. The wavelength is 656.3 nm which is
in the red (lower energy) part of the
spectrum. This wavelength is given by the
single electron in the Hydrogen
atom
dropping to the second
orbit (more in the
physics section). The
temperature of the
inner portion of this layer is lower (at
4400 K) than the photosphere, but jumps
suddenly to 25,000 K. From this point to the
transition into the Corona, the
temperature jumps sharply to 400,000 degrees. The reason
for this is not clearly understood and
remains an active subject to Astronomers
studying the Sun, but suspect the magnetic
flux as a result of (as well as resulting
in) sunspot formation might provide some
clues. |
| Photosphere |
The Photosphere, Chromosphere and Corona
are the three layers that make up the
"atmosphere" of the Sun. The Photosphere is
the inner-most layer and is the layer we
easily see every day. It burns at 5800 K.
Oddly enough, the photosphere is opaque to
light, only allowing transferred
energy from
the convection layer below. It is the opaque
feature of the photosphere that shields us
from directly viewing the thermonuclear core
and provide the shape of the Sun. The
transferred
energy from the convection zone
below occurs in the form of granules (see
the photo above). As the hotter gas rises
up, the cooler gas descends only to be
re-heated by the convection layer and the
process repeats itself. Sometimes
disturbances in the magnetic field will
produce sunspots, which occur within this
layer, but more on that later. |
| Convective Zone |
We cannot visualize past the
photosphere, but we can create models and
examine particles emanating from the Sun to
get an idea to the Sun's interior structure.
Three internal layers dominate the anatomy
with the outer layer (just under the
photosphere) called the convective zone.
Radiation is not an effective mean of
generating the heat
energy produced by the
core, so the convective layer acts as the
buffer to stabilize this
energy. Once a
photon enters the convective zone, it can
take 170,000 years for it to reach the
photosphere. The action of the
photon is
something called the "random walk" where the
photon collides with other
photons mainly
because the opacity of this zone it a bit
high. While there is some pretty unforgiving
mathematics involved in determining exactly
how much opacity there it, it is important
to know the convective zone helps maintain
the hydrostatic equilibrium within the Sun
by acting as a buffer. |
| Radiative Zone |
This layer of the Sun is responsible for
delivering the
photons from the Core to the
Convective layer. The radiative layer
"radiates" the
energy by the emission and reabsorbtion of
photons. |
| Core |
The heart of the Sun is the core. Not
much to say here accept the gravity was
strong enough to bring Hydrogen together to
initiate
fusion. The magic
temperature for
fusion is 10,000,000 K. The
energy released
is balanced by the radiative and convective
layers of the Sun to create the hydrostatic
equilibrium necessary to prevent the Sun
from flying apart or to burn its fuel to
fast. |
To summarize the layers and atmosphere dynamic of
the Sun (based on current solar models):
| Core |
Radius of 150,000 km |
10,000,000 K |
| Radiative Zone |
300,000 km thick |
8,000,000 K |
| Convective Zone |
200,000 km thick |
500,000 K |
| Photosphere |
500 km thick |
5800 K |
| Chromosphere |
10,000 km thick |
4,000 to 400,000 K |
| Corona |
5,000,000 km thick |
1,000,000 K |

Sunspots:
These three images show sunspots in different
perspectives. The image is not of the same subject,
but the idea is the same.
 |
 |
 |
| (Figure 1) This is a photographic image
of a sunspot group. |
(Figure 2) This is a magnetogram of a
sunspot group that shows magnetic polarity. |
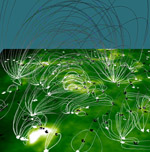
(Figure 3) This is a graphical example
of magnetic field lines connected to
sunspots. |
Looking at the diagram at the top of this page,
you will notice that sunspots have two main parts:
an umbra and a penumbra (figure 1). The umbra is the
main sunspot while the penumbra is the lighter
surroundings. The
temperature of a sunspot is lower
than the surrounding photosphere, but not by much.
The sunspot itself will be around 4000 K while the
photosphere is 5800 K (in the middle is the
surrounding penumbra at 5000 K). The magnetogram
(figure 2) shows a sunspot group by color: black and
white. These are a graphical interpretation of
sunspot polarity, and black is positive while the
white is negative. These two poles are connected by
magnetic field lines shown in figure 3.
The magnetic characteristics of sunspots was
discovered by the Zeeman effect (named after Pieter
Zeeman). While examining a spectral line over a
sunspot, the line appeared to split into three, and
bend toward each other (figure 4).
 |
 |
| (Figure 4) The Zeeman
effect causes the apparent separation of a
single spectrum line. |
(Figure 5) The
differential rotation of the Sun causes
eventual twisting of the magnetic fields.
Eventually, the magnetic field undoes itself
as rotation continues. |
Sunspots are caused by the differential rotation
of the sun. Since the Sun is not a solid body, the
equatorial region of the Sun spins faster. This has
the effect of twisting the magnetic fields as seen
in figure 5. The winding also produces a curious
effect; as the magnetic field reaches its maximum at
11 years, the polarity of the magnetic field
switches while the fields start to unwind until the
11 year minimum is reach. The Sun has a 22 year
cycle.
Figures 4 and 5 appear in the Freedman and
Kaufman text, Universe (see the references
section), but the images are borrowed from:
http://homepage.smc.edu/balm_simon/winter2004/astro1034a/lect10.html
Solar Storms:
Sunspot activity also gives rise to Solar Storms. Solar wind is a normal daily occurrence due to coronal heating. Solar Wind is made up of energized electrons and photons. It's speed varies from 800 km/s from coronal holes to 300 km/s from streamers. As you would guess, Solar Wind is not uniform. It's average speed is 400 km/s. The main concern are Coronal Mass Ejections resulting from solar flares and prominences. Large amounts of ionized gas are ejected from the Sun and can cause catastrophic events on Earth. The Space Weather Prediction Center of NOAA have created scales that rate these as well as Geomagnetic Storms and Radio blackouts.
See also: Space Weather Alerts and Space Weather Now
Geomagnetic Storms (look for increased Auroral activity)
| Scale |
Descriptor |
Effect |
Physical Pressure - Kp values every 3 hours |
Average Frequency (1 cycle = 11 years) -
Storm events at Kp value |
| G 5 |
Extreme |
Power systems: : widespread voltage control problems and protective system problems can occur, some grid systems may experience complete collapse or blackouts. Transformers may experience damage.
Spacecraft operations: may experience extensive surface charging, problems with orientation, uplink/downlink and tracking satellites.
Other systems: pipeline currents can reach hundreds of amps, HF (high frequency) radio propagation may be impossible in many areas for one to two days, satellite navigation may be degraded for days, low-frequency radio navigation can be out for hours, and aurora has been seen as low as Florida and southern Texas (typically 40° geomagnetic lat.). |
Kp = 9 |
4 per cycle
(4 days per cycle) |
| G 4 |
Severe |
Power systems: possible widespread voltage control problems and some protective systems will mistakenly trip out key assets from the grid.
Spacecraft operations: may experience surface charging and tracking problems, corrections may be needed for orientation problems.
Other systems: induced pipeline currents affect preventive measures, HF radio propagation sporadic, satellite navigation degraded for hours, low-frequency radio navigation disrupted, and aurora has been seen as low as Alabama and northern California (typically 45° geomagnetic lat.). |
Kp = 8, including a 9- |
100 per cycle
(60 days per cycle) |
| G 3 |
Strong |
Power systems: voltage corrections may be required, false alarms triggered on some protection devices.
Spacecraft operations: surface charging may occur on satellite components, drag may increase on low-Earth-orbit satellites, and corrections may be needed for orientation problems.
Other systems: intermittent satellite navigation and low-frequency radio navigation problems may occur, HF radio may be intermittent, and aurora has been seen as low as Illinois and Oregon (typically 50° geomagnetic lat.). |
Kp = 7 |
200 per cycle
(130 days per cycle) |
| G 2 |
Moderate |
Power systems: high-latitude power systems may experience voltage alarms, long-duration storms may cause transformer damage.
Spacecraft operations: corrective actions to orientation may be required by ground control; possible changes in drag affect orbit predictions.
Other systems: HF radio propagation can fade at higher latitudes, and aurora has been seen as low as New York and Idaho (typically 55° geomagnetic lat.). |
Kp = 6 |
600 per cycle
(360 days per cycle) |
| G 1 |
Minor |
Power systems: weak power grid fluctuations can occur.
Spacecraft operations: minor impact on satellite operations possible.
Other systems: migratory animals are affected at this and higher levels; aurora is commonly visible at high latitudes (northern Michigan and Maine). |
Kp = 5 |
1700 per cycle
(900 days per cycle) |
Solar Radiation Storms
| Scale |
Descriptor |
Effect |
Physical Pressure - Flux level of >= 10 MeV particles |
Average Frequency (1 cycle = 11 years) - Number of events at Flux value |
| S 5 |
Extreme |
Biological: unavoidable high radiation hazard to astronauts on EVA (extra-vehicular activity); passengers and crew in high-flying aircraft at high latitudes may be exposed to radiation risk.
Satellite operations: satellites may be rendered useless, memory impacts can cause loss of control, may cause serious noise in image data, star-trackers may be unable to locate sources; permanent damage to solar panels possible.
Other systems: complete blackout of HF (high frequency) communications possible through the polar regions, and position errors make navigation operations extremely difficult. |
110^5 |
less than 1 per cycle |
| S 4 |
Severe |
Biological: unavoidable radiation hazard to astronauts on EVA; passengers and crew in high-flying aircraft at high latitudes may be exposed to radiation risk.
Satellite operations: may experience memory device problems and noise on imaging systems; star-tracker problems may cause orientation problems, and solar panel efficiency can be degraded.
Other systems: blackout of HF radio communications through the polar regions and increased navigation errors over several days are likely. |
10^4 |
3 per cycle |
| S 3 |
Strong |
Biological: radiation hazard avoidance recommended for astronauts on EVA; passengers and crew in high-flying aircraft at high latitudes may be exposed to radiation risk.
Satellite operations: single-event upsets, noise in imaging systems, and slight reduction of efficiency in solar panel are likely.
Other systems: degraded HF radio propagation through the polar regions and navigation position errors likely. |
10^3 |
10 per cycle |
| S 2 |
Moderate |
Biological: passengers and crew in high-flying aircraft at high latitudes may be exposed to elevated radiation risk.
Satellite operations: infrequent single-event upsets possible.
Other systems: small effects on HF propagation through the polar regions and navigation at polar cap locations possibly affected. |
10^2 |
25 per cycle |
| S 1 |
Minor |
Biological: none.
Satellite operations: none.
Other systems: minor impacts on HF radio in the polar regions. |
10 |
50 per cycle |
Radio Blackouts
| Scale |
Descriptor |
Effect |
Physical Pressure - X-ray peak brightness by Class and by Flux |
Average Frequency (1 cycle = 11 years) |
| R 5 |
Extreme |
HF Radio:Complete HF (high frequency) radio blackout on the entire sunlit side of the Earth lasting for a number of hours. This results in no HF radio contact with mariners and en route aviators in this sector.
Navigation: Low-frequency navigation signals used by maritime and general aviation systems experience outages on the sunlit side of the Earth for many hours, causing loss in positioning. Increased satellite navigation errors in positioning for several hours on the sunlit side of Earth, which may spread into the night side. |
X20
(2 x 10^-3) |
Less than 1 per cycle |
| R 4 |
Severe |
HF Radio: : HF radio communication blackout on most of the sunlit side of Earth for one to two hours. HF radio contact lost during this time.
Navigation: Outages of low-frequency navigation signals cause increased error in positioning for one to two hours. Minor disruptions of satellite navigation possible on the sunlit side of Earth. |
X10
(10^-3) |
8 per cycle
(8 days per cycle) |
| R 3 |
Strong |
HF Radio: Wide area blackout of HF radio communication, loss of radio contact for about an hour on sunlit side of Earth.
Navigation: Low-frequency navigation signals degraded for about an hour. |
X1
(10^-4) |
175 per cycle
(140 days per cycle) |
| R 2 |
Moderate |
HF Radio: Limited blackout of HF radio communication on sunlit side, loss of radio contact for tens of minutes.
Navigation: Degradation of low-frequency navigation signals for tens of minutes. |
M5
(5 x 10^-5) |
350 per cycle
(300 days per cycle) |
| R 1 |
Minor |
HF Radio: Weak or minor degradation of HF radio communication on sunlit side, occasional loss of radio contact.
Navigation: Low-frequency navigation signals degraded for brief intervals. |
M1
(10^-5) |
2000 per cycle
(950 days per cycle) |
X-Ray Solar Flare Classification:
Stored energy across magnetic field lines (above sunspots) can break and erupt into Solar Flares. These flares are a part of Solar Storms, and can sometimes be in the X-ray and gamma ray portion of the spectrum. The chart below demonstrates X-ray classifications of these flares, to offer clarity for Radio Blackouts.
| Class |
Peak (W/m^2) between 1 and 8 angstroms |
| B |
I < 10^-6 |
| C |
10^-6 <= I < 10^-5 |
| M |
10^-5 <= I < 10^-4 |
| X |
I >= 10^-4 |
Each category has 9 subdivisions, 1-9. For example, B1, B2,....B9.
X class flares are big with wide ranging effects on Earth like planet wide radio blackouts and long lasting radiation storms. M class flares are moderate affect mostly the polar region with radio blackouts. C class flares are small. Back to Top
|

