|
Optically Identifying 20cm Radio Sources by Ricky Leon Murphy:
Back to Astrophotography
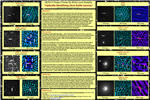
Click for poster
Introduction
Radio Astronomy
The Very Large Array
The NRAO VLA Sky Survey
The VLA Faint Images of the Radio Sky at Twenty-Centimeters (FIRST)
Project Methods
Acquiring NVSS Radio Images
Acquiring FIRST Radio Images
NASA SkyView - NVSS Alternative
Telescope Use - CCD Image Acquisition
CCD Image Processing
Astrometry
Object Identification
Summary of Methods
Objects
3C218
3C273
3CR270.0
3CR272.1
3C277.3
3C405
3CR348
3C461
Discussion
Summary
References
Website References
Figures
“Optically Identifying 20 cm Radio Sources”
1.
Introduction:
Radio astronomy gives us a unique view
of the Universe. Many of the emission processes powering phenomenon like
quasars, radio galaxies, Seyfert galaxies and other active galactic nuclei as
well as supernova remnants are invisible using standard optical imaging.
However, the object of emission is visible on film (or CCD). For this project, I
have a list of eight radio objects that I will identify optically. Using
coordinates provided by NED (NASA/IPAC Extragalactic Database), I will train a
remotely controlled, 0.5 meter telescope to each object and capture on CCD the
optical counterpart. The goal is to overlay the radio image over the CCD image
in an attempt to identify the specific object of emission. In addition, I will
summarize the object with a brief description as well as identifying the specific
emission source responsible for the radio emission. The purpose of the project
will be to demonstrate my effectiveness in identifying the optical counterpart
of the radio source as well as justifying the need to capture these types of
objects in both the optical and radio wavelengths. Note to the reader:
computer and Internet commands and software menu items are capitalized for
clarity.
Back to Top
2. Radio
Astronomy:
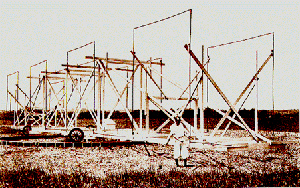
In 1931, Karl Jansky was tasked by the
Bell Telephone Labs to determine the cause of static over long distance
telephone lines. He constructed a large device in an attempt to detect any stray
radio waves.
(Figure
1)
By 1932, the device was working and
detecting anomalous radio emission, but Jansky determined the emission was
coming from a specific region of the sky – traced along the Milky Way galaxy [W6].
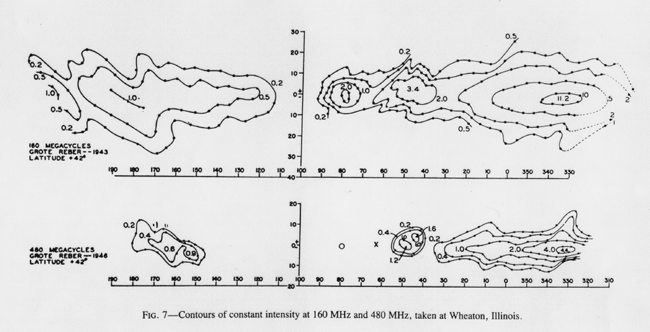
Grote Reber, an amateur Ham radio operator, learned of Jansky’s discovery and
wanted to follow up. After being denied a position at Bell Labs to work with
Jansky, he decided to work alone, constructing the first ever radio dish in his
back yard. In 1937, he began scanning the regions of the Milky Way at a variety
of frequencies, finally settling on 160 MHz – successfully detecting and
confirming the emissions initially detected by Jansky [W5].
(Figure
2)
The image above shows the map of the
Milky Way Galaxy as detected by Reber’s backyard dish [W5].
While Reber attempted to define the
cause of the emission, it wasn’t until 1950 that V.L. Ginzburg, a Russian
Physicist, theorized the radio emission was the result of synchrotron radiation
– a non-thermal emission process which is the result of electrons traveling near
the speed of light along magnetic field lines [W5].
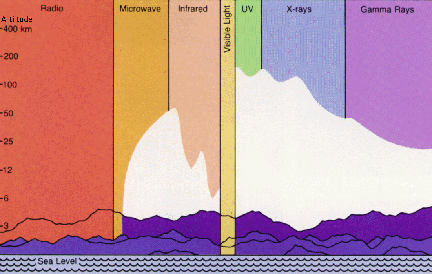
Our atmosphere serves as a protector
against high energy particles like gamma rays and UV radiation, but the lower
energy of radio and optical waves (with just a dash of microwave) passes through
with little or no resistance – in other words, transparent.
(Figure
3)
While we must send probes above the
atmosphere to examine phenomenon in the high energy wavelengths like X-ray and
Gamma-Ray, we can safely and freely observe the Universe in radio and optical
wavelengths from the ground using optical and radio telescopes.
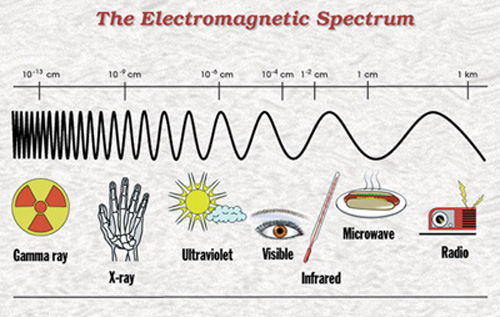
(Figure
4)
The radio wavelengths – as seen in the
electromagnetic spectrum diagram above (cute, isn’t it) – are very long and
requires a large “telescope” to detect them. Reber’s dish was 9.5 meters in
diameter, but the larger the better – just like an optical telescope. A radio
telescope is in the shape of a dish for good reason – radio emissions occur on
Earth in the form of radio interference from telephones, radio stations, TV
stations, cell phones, blenders, and so on and the shape of the dish helps to
block any local emission. Radio observatories are usually in remote areas far
from any possible interference. In addition, the dish shape prevents any
interference from the ground and focuses the radio emission from the sky to the
antenna.
While describing the technology, design
and functionality of a radio telescope is beyond the scope of this project, the
image below demonstrates the basic parts and functions of a radio telescope. In
simple terms, just as light is focused by a lens or mirror to an eyepiece, the
radio dish focuses radio waves to an antenna which contains a receiver – sort of
an electronic version of an eyepiece.
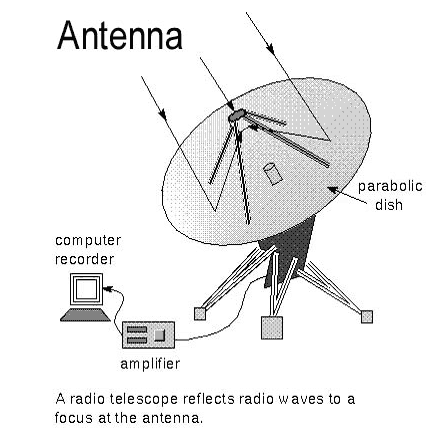
(Figure
5)
Because of structural limitations, the
largest steerable radio telescope – that is a radio telescope that can move
along both axes – is 100 meters. The famous 300 meter Arecibo dish in Puerto
Rico (the one used by the
SETI@Home folks) is also a single dish design, but is
built into the ground. In order to improve resolution, a larger radio dish is
required. To get around the inherent design flaws of a single large dish – an
interferometer is created by using a series of two or more dishes. Interferometry uses the phase difference between signal arrival time between two
or more radio dishes (Kutner, 2003). The phase difference combined with the
distance between the dishes allows for a “virtual” radio dish with a diameter
equal to the distance between the dishes. In other words, if the separation
between two dishes is 500 meters, the effective diameter of the “virtual” dish
is 500 meters. However, there are limitations which will require additional
dishes inside the overall diameter to compensate. One such limitation is
angular resolution – the ability to discern small details. While the reasons and
the maths involved are well beyond the scope of the project, it should be known
that the Very Large Array in Socorro, New Mexico solves these limitations.
Back to Top
3.
The Very Large Array:
The Very Large Array (VLA) is a member
of the National Radio Astronomy Observatory. Its array of 27 dishes is located
50 miles west of Socorro, New Mexico – on the plains of San Agustin [W7].
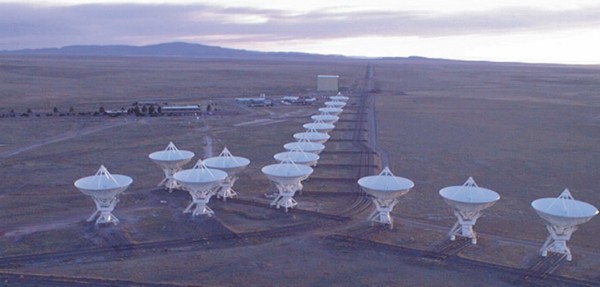
(Figure
6)
The VLA is an interferometer, meaning
the dishes all work together to create a large dish capable of high resolution
imaging. Each dish is 25 meters in diameter and weighs 230 tons. The Y-shaped
array is capable of four different configurations [W7]:
- The A array – maximum dish
separation of 36 kilometers
- The B array – maximum dish
separation of 10 kilometers
- The C array – maximum dish
separation of 3.6 kilometers
- The D array – maximum dish
separation of 1 kilometer
Changes in array configurations occur
about every 4 months. In addition to a variety in dish configurations, a variety
of receivers are also available. The receiver of a radio telescope determines
the frequency, beam and resolution [W7].
Table 1:
|
|
4 Band |
P Band |
L Band |
C band |
X band |
U Band |
K band |
Q band |
|
Frequency (GHz) |
0.073-0.0745 |
0.30-0.34 |
1.34-1.73 |
4.5-5.0 |
8.0-8.8 |
14.4-15.4 |
22-24 |
40-50 |
|
Wavelength (cm) |
400 |
90 |
20 |
6 |
3.6 |
2 |
1.3 |
0.7 |
|
Primary beam (arcmin) |
600 |
150 |
30 |
9 |
5.4 |
3 |
2 |
1 |
|
Resolution (arcsec) |
24.0 |
6.0 |
1.4 |
0.4 |
0.24 |
0.14 |
0.08 |
0.05 |
Back to Top
4.
The NRAO VLA Sky Survey:
The
NRAO VLA Sky Survey, or the NVSS,
used the VLA array from 1993 to September 1996. The survey covers the entire
northern hemisphere from declination -40 degrees. While not the only radio sky
survey, this survey made use of the lower noise L-Band receiver that was just
installed prior to data acquisition (Condon
et al., 1998).
The purpose of the survey is two-fold:
- The data collected by the
NVSS was made to service the Astronomical Community
- To catalog the two major
radio emissions – the strong and the weak
The strong radio emissions come from
extra-galactic sources like active galactic nuclei (AGN) and radio loud
galaxies. Weak sources of radio come from supernova remnants (Condon
et al., 1998).
All the data from the NVSS is available
online, and for those who use a UNIX based computer, software is also available
to search and download data.
Back to Top
5.
The VLA Faint Images of the Radio Sky at Twenty-Centimeters (FIRST):
The
VLA FIRST survey is a project designed
to map 10,000 square degrees over the north and south galactic poles. Using the
B configuration of the VLA interferometer, image resolution is a sharp 5
arcseconds and is designed to pinpoint faint radio sources at 20cm. Even with 3
minute images, 50% of the FIRST survey catalog will have optical counterparts
brighter than a magnitude of 23. It will be possible to detect the weaker
portion of a radio signal even in the midst of “brighter” radio lobes (Becker
et al, 1997).
The FIRST survey will compliment other
surveys – such as the NVSS – providing image resolution 10 times that of the
other surveys currently available. The FIRST has been instrumental in the
detection and continued study of quasars. The vast majority of published papers
based on the FIRST survey (http://sundog.stsci.edu/first/publications.html#catalog)
indicate its valuable resource for quasar research.
Back to Top
6.
Project Methods:
By determining the coordinates of a
given list of eight radio objects, I will train a remotely controlled telescope
using the determined coordinates to locate the optical counterpart of each radio
object. The prerequisites of this project will require:
- A computer with Internet
connection
- A telescope with ample
aperture and a CCD camera
- Software to control the
telescope and process the images
By taking this class, I have already
demonstrated that I have a computer with Internet access. Such a tool will allow
me to visit websites required to complete this project including the websites
for the
NVSS and
FIRST survey.
The list of radio objects provided by my
project supervisor:
|
Object |
Other Name |
Coordinates |
|
|
|
|
|
3C218 |
Hydra A |
09h18m05.7s
-12d05m44s |
|
3C273 |
|
12h29m06.7s
+02d03m09s |
|
3CR270.0 |
NGC
4261 |
12h19m23.2s +05d49m31s |
|
3CR272.1 |
M84 |
12h25m03.7s
+12d53m13s |
|
3C277.3 |
Coma A |
12h54m11.7s
+27d37m33s |
|
3C405 |
Cygnus A |
19h59m28.3s
+40d44m02s |
|
3CR348 |
Hercules A |
16h51m08.1s
+04d59m33s |
|
3C461 |
Cassiopeia A |
23h23m25.4s
+58d48m38s |
Table 2:
List of objects, common names and
coordinates in Right Ascension and Declination.
Using NED (http://nedwww.ipac.caltech.edu/)
I was able to determine the coordinates of each target. In addition, I was
provided with a common name. This is sometimes helpful when searching through
the NVSS database (or any other) in the event the object number is not
recognized. The left-hand set of coordinates is the Right Ascension while the
right-hand set of numbers corresponds to the Declination. A visit to the NED
website presents me with several options – one of which is “Objects
– By Name” seen in Figure 7.
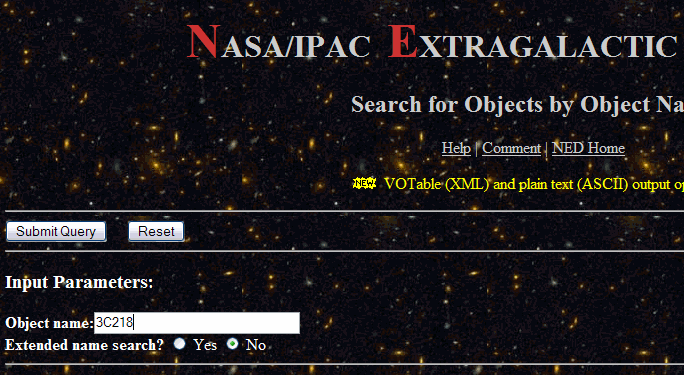
(Figure
7)
With this page, I simply enter the
object number, in this case 3C218, then click the SUBMIT QUERY button.
I am now presented with a summary page
with a wealth of data, but I am only interested in the first few lines of data –
namely the coordinates of the object (figure 8).
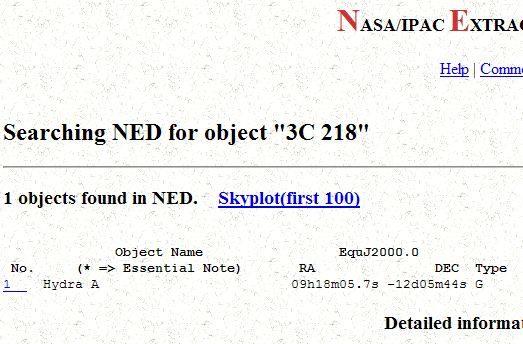
(Figure
8)
The coordinates listed were used to
complete
Table 2.
Back to Top
7.
Acquiring NVSS Radio Images:
A visit to the
NVSS website gives me plenty of data and links, but for this project I am
interested in the ‘Postage Stamp Server’ (http://www.cv.nrao.edu/nvss/postage.shtml).
This is an online version of the image view tool that offers a JPEG or FITS
version of the radio image.
The search window is a bit complicated (figure
9) in that the Desired Image Size and Pixel Spacing cannot exceed an image
size of 512 x 512. This is somewhat limiting as I have determined that my
desired image size is to be 680 x 680 – discussed below.
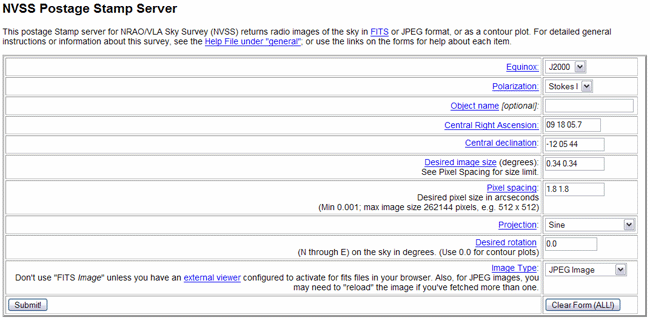
(Figure
9)
The parameters I enter here are the
object coordinates – in this case, the coordinates for 3C218 – a desired image
size of 0.34 degrees and a pixel spacing value of 1.8 (having to enter “1.8 1.8”
for a square image). These values will give me a desired image size of 680 x
680, but since this exceeds the allowed limit, I am presented with the dialog in
figure 10.

(Figure
10)
A pixel spacing value of “2.5 2.5” would
have given me an image, in which case the image would simply appear in the
browser window as a JPEG. Of important note,
figure 10 gives me an option to download the RAW IMAGE file, but this is a
compressed FITS file that is 32 bit. Only software capable of opening 32 bit
images (like Mira Pro) can view this image – and the image is not
centered on the desired coordinates.
There is an alternative to retrieve NVSS
images in the desired image size using the NASA SkyView database, but I will
cover that in a moment.
Back to Top
8.
Acquiring FIRST radio images:
The
FIRST website is much easier to navigate. A visit to the main site presents
me with several options, one of which is IMAGES (pretty self-explanatory). The
IMAGES page has some useful information about the project, and includes a link
to the
FIRST Cutout Server – the tool used to extract the radio images from this
survey:
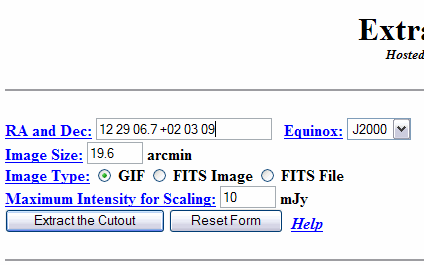
(Figure
11)
This page (figure 11) is rather simple
to use – enter the coordinates and image size. The CCD camera I will use has a
19.6 x 29.8 arcminute field of view, so the parameter I chose for image size is
19.6 arcminutes:
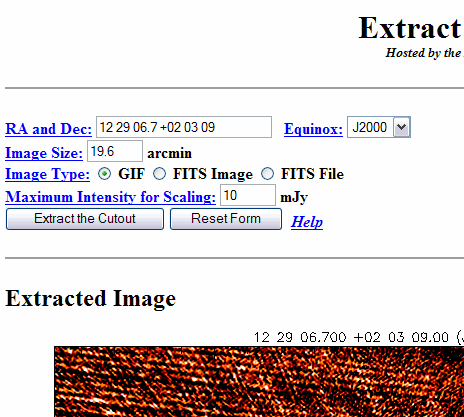
(Figure
12)
The image that is extracted will be
below the text “Extracted Image.” I did not include the entire screen shot (figure
12) as the image is large. It turns out the image itself (minus the legend
data) is 680 x 680 which is how I determined the desired size for the NVSS
search.
Back to Top
9.
NASA SkyView – an NVSS Alternative:
As mentioned earlier, the NVSS Postage
Stamp Server is limited in its image extraction size. I recently learned that
the
NASA SkyView service offers database access to almost all database images
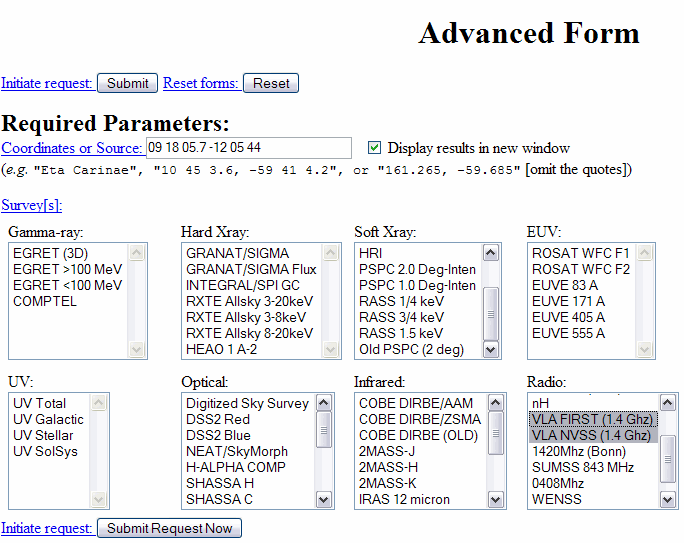
(optical, radio, gamma-ray, x-ray, and other images). The
NASA SkyView homepage has a choice of interface; however, for our purpose
the
Advanced Interface is more than enough (figure 13).
(Figure
13)
The search is similar to the NVSS and
FIRST database – entering the coordinates will retrieve the image. The SkyView
database has the added option of using a target name instead of a set of
coordinates – it confirms the target name through
SIMBAD (an
astronomical database) and extracts
coordinates from that database. However, by using coordinates instead of a name I am
guaranteed the center of the retrieved image will be the specified coordinates.
In addition to the coordinates, I must
select a survey. In this example (figure
13), I selected both the NVSS and FIRST surveys.
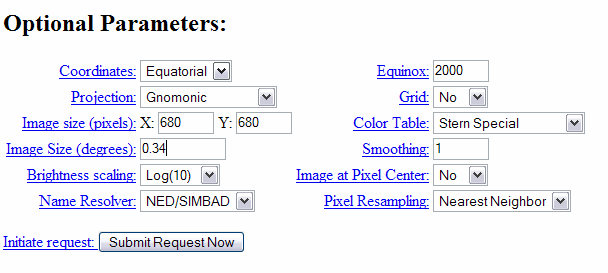
Because I am concerned over image size
parameters, this page has many options – available by scrolling down:
(Figure
14)
These optional parameters are used to
constrain the image size – in our case, a 0.34 degree image with an image size
of 680 x 680. Click on the SUBMIT REQUEST NOW button to retrieve the desired
image. The results will display both images in a new window (if there is only an
NVSS image, only the NVSS image will be displayed).
Because my FIRST radio images are
already 680 x 680 based, I acquired the NVSS radio images
through SkyView instead of through the NVSS - 1.8 pixel space at 0.34 degree
field of view - to ensure equal image size based on my CCD chip specifications.
Back to Top
10.
Telescope Use – CCD Image
Acquisition:
The capture of images is the meat and
potatoes of the project – and the most fun. While I could most certainly acquire
all my images through NASA’s SkyView, that would be cheating and no fun at all!
The telescope I will use is an
RC
Optical Systems 20 inch Ritchey-Chrétien design
(the specifications and field of
view come from the observatory website and CCD calculator software,
CCDCalc).
- 4300mm focal length
- 8.3 f/ratio
This design is ideal for
astrophotography as there is no coma (due to mirror shape) and no focus
variations (due to open tube and tight primary mirror integration). The
telescope is housed at the Blackbird Observatory in New Mexico, a private
observatory owned and operated by Ron Wodaski (although there was a transfer of
ownership during the course of the project). Through the use of my American
Express Card, he has been gracious enough to allow me time on his telescope to
complete this project.
The telescope sits on a
Software Bisque
Paramount ME robotic mount which is capable of <5 arcseconds of periodic error.
Tracking is performed via separate telescope and guide camera. The CCD camera is
a Santa Barbara Instruments Group
STL-11000M:
- 11 million pixels – 4008 x
2672
- 36 x 24.7mm chip
- 9 micron pixel size
- Anti-bloom gate
- 13 e- read noise
- 50,000 e- full well
capacity
The telescope system is controlled by
Software Bisque’s Internet Astronomy powered by
TheSky and
CCDSoft.
The CCD camera and telescope provide an
image of:
- Field of view
≈
19.6 x
29.8 arcminutes, 0.34 x 0.50 degrees
- Image scale = 0.44
arcseconds/pix
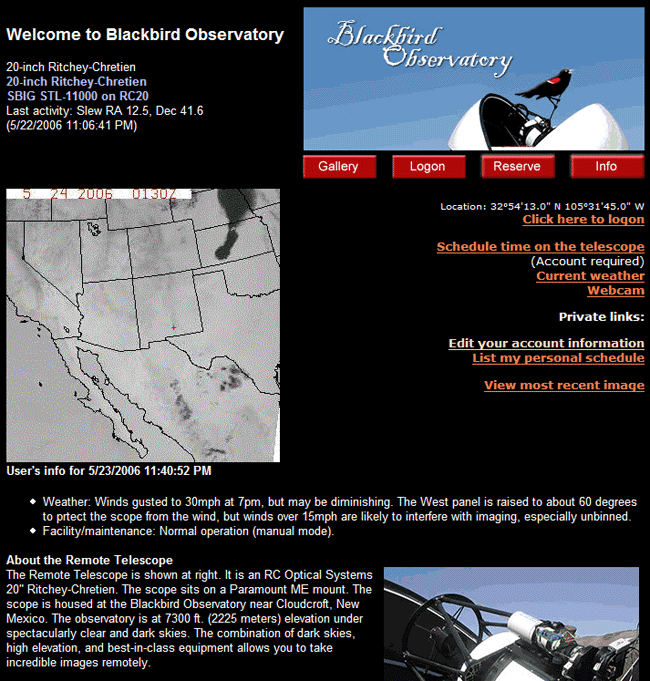
Images are acquired through the Browser
Astronomy package using CCDSoft for camera control.
(Figure
15)
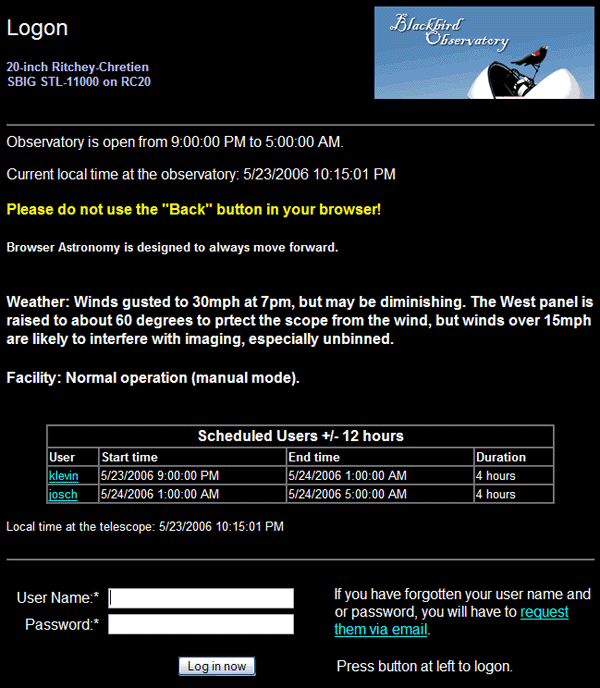
The LOG IN page has important
information. For one, it will list the current weather and observatory status.
It will also list the schedule of users for the day. If no one is logged in, you
will see a page like figure 16 – but if someone is logged
in, a page like figure 17 will display.
(Figure
16)
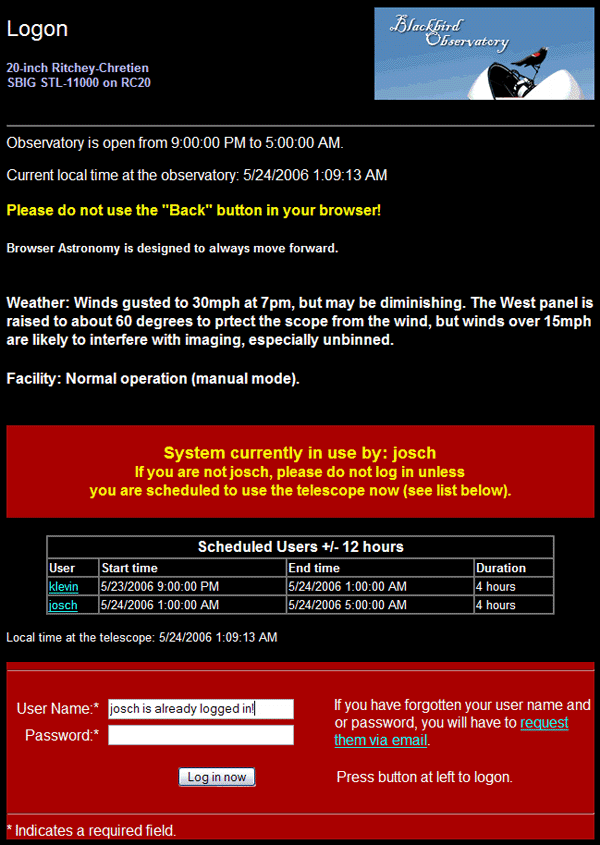
(Figure
17)
After logging in…
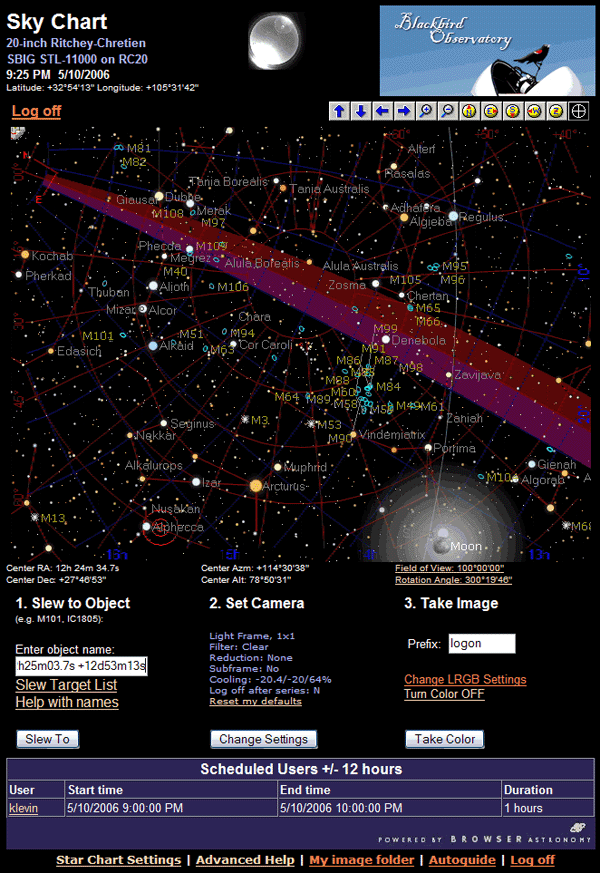
(Figure
18)
After logging into to the Blackbird
Observatory website, I am presented with the screen shown above. The interface
is painfully simple as everything in regards to alignment is already taken care
of. There are only three items on this page to be concerned about:
- The Slew to Object box
- The Take Image block
- The Autoguide link at the
bottom next to Log Off
The first step is to enter the
coordinates into the Slew to Object box, followed by clicking the SLEW TO
button.
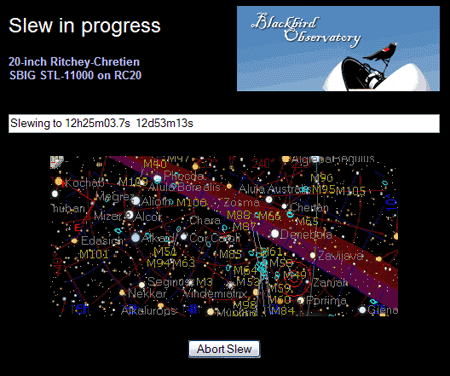
(Figure
19)
The program offers a real-time look into
the slewing progress. You have an option to ABORT SLEW if you find that you
entered the wrong coordinates. I did not have this problem.
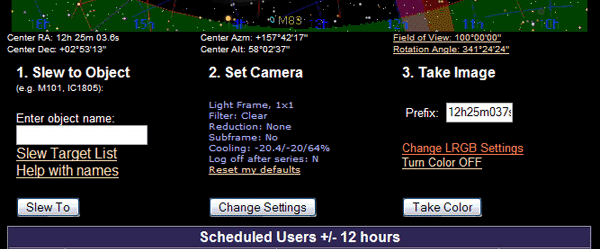
(Figure
20)
After the slew is complete, the first
page is refreshed, this time with the object of interest centered. You will know
your target has been centered by the Take Image box – the coordinates will
appear in the Prefix field (Figure
20) – if your object were M84 for example, the text "M84" would be in this box.
Once the object is centered, autoguiding
must be turned on and a guide star selected. The observatories default option is
the autoguider is always running so a guide star must be selected. Once the
AUTOGUIDING link is clicked (bottom of
figure 20), a new window opens:
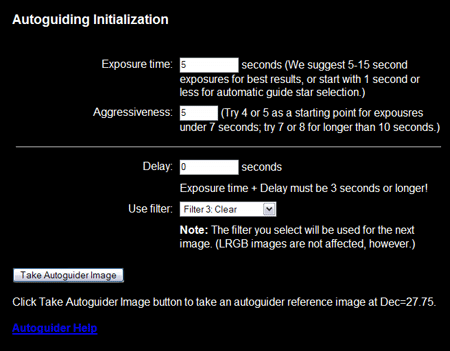
(Figure
21)
These are the default parameters for the
autoguider settings. These settings are fine, but can be adjusted if a guide
star is not located. Click the TAKE AUTOGUIDER IMAGE button to initiate
autoguider capture.

(Figure
22a)
Figure 22a shows a progress of the autoguider capture. When
complete, a window opens with the result of
the image capture. The smaller image window should display some white stars
(figure 22b).
Choose a star and click on it.
If there are no stars, you can CLICK HERE TO START OVER and
change the parameters as seen on figure 21.
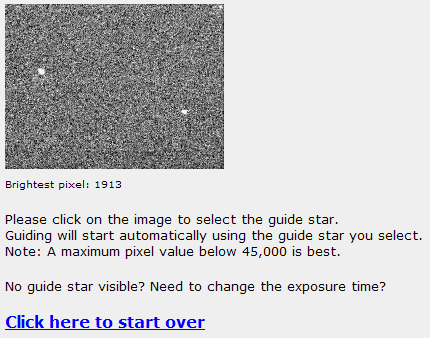
(Figure
22b)
Once the star is clicked, the autoguider
analyzes the tracking errors and adjusts the mount to compensate. When the error
reaches an acceptable level, you are given one option, CLICK TO CLOSE (figure
22c). This page
is designed to inform you the mount is tracking properly.
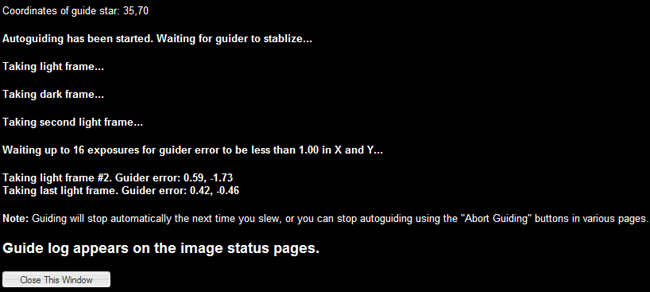
(Figure
22c)
The autoguider starts and the user is
once again presented with the main page as seen in
Figure 18.
The final setting will be the Change
LRGB Settings in the Take Image block:
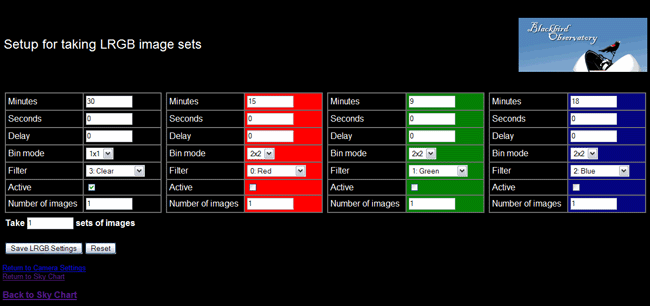
(Figure
23)
These settings will define how long the
image is captured in each filter. If you want an LRGB image, all the Active
radio boxes should be selected. In this case, only the Luminance filter is
active, and the timing of the image is 30 minutes.
In addition to the timing, I decided to
select 2x2 (figure 23
shows a 1x1 bin mode) binning on my images. Since the majority of the targets are faint, I
prefer the increased sensitivity to a 2x2 bin mode (basically doubling the pixel
size - analogous to film speed).
When satisfied with the settings, click
the SAVE LRGB SETTINGS button. Again, the user is brought to the main page as
seen in
Figure 18.
The final step to this process is to
click the TAKE COLOR button. There is a status page when image capture is in
progress:
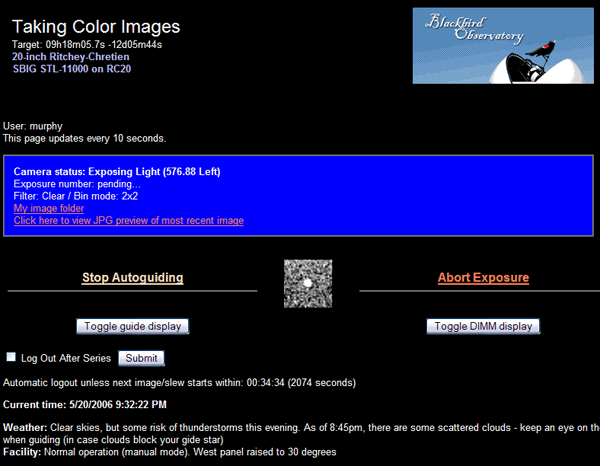
(Figure
24)
This page shows the guide star as well
as graphs that demonstrate the status of “seeing” conditions (DIMM) and guide
star patterns. This information is really not that helpful so I have disabled
them.
Once image capture is complete, you are
given some options:
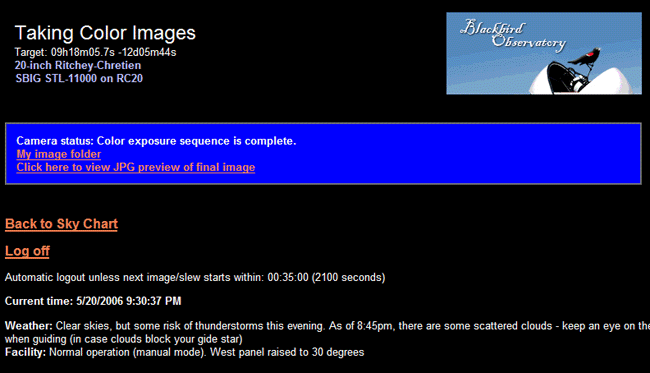
(Figure
25)
You can view the image folder, go back
to the main page or log off.
There are steps to take if I want to
take Luminance only images, or change the binning as well as capture reduction
frames. I can also change some of the default actions of the guider – like
planet guiding, comet or asteroid guiding, even turning the guiding feature off
– but these steps will not be covered.
Back to Top
11.
CCD Image Processing:
Once the images are captured, they are
stored on the observatory’s local server – along with any image reduction frames
that are provided (bias frames, flat frames and dark frames). Images are
downloaded and run through MaxIm DL for calibration (more
on calibration here):
-
Open the raw image in MaxIm and save
a copy of it
-
Use the calibration wizard to set
the location of the Bias, Dark and Flat frames
-
Calibrate the image
The Bias frame sets the black point of
the image while the Dark frame compensates for electronic noise. The Dark frame
should be equal in exposure as the light frame (light frame means the actual
image). The Flat field is an image of the telescope optics, filters and camera
protective plate and any CCD chip blemishes – this means that any blemishes on
the chip, scratches and dust are imaged. This is divided from the light frame
and provides a much cleaner and better looking image. It can also equalize the
gradient in the background. Visit the
Image
Reduction page for more information.
Additional processing of pixel removal –
any dead or hot pixels – is also performed through MaxIm DL. The SBIG STL-11000M
chip does not include an overscan region so image reduction is a straight
forward process (overscan is a feature used on professional CCD cameras that
provide automatic Bias, among other things).
Once calibration is complete, the image
can be astrometrically calibrated using Mira Pro (the astrometry program in
MaxIm DL is not perfect, and has crashed when attempting astrometry on the
images I captured).
Back to Top
12.
Astrometry:
Astrometry determines where an object is
in an image. When we determine the equatorial coordinates of a few known stars,
we can calibrate the image so that when our cursor is located anywhere on the
image, we will know the equatorial coordinates of the cursor location. This is
helpful when looking for something that is not that obvious – like a galaxy that
looks like a star, a supernova, or an asteroid.
Using TheSky Professional (which uses
both the GSC and USNO B catalogs), I can identify bright stars in the field of
interest, but I need a field of view indicator to know where to look. In my
version of TheSky, this is located under the VIEW menu. Select FIELD OF VIEW
INDICATORS:
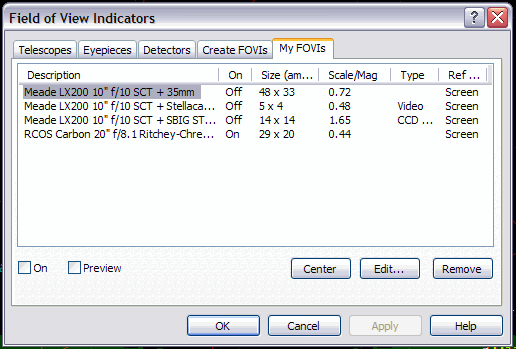
(Figure
26)
I can create an FOVI (Field Of View
Indicator) by clicking the Create FOVIs tab (all I need is the focal length and
aperture of the telescope). I am using the RCOS Carbon 20” telescope, so I name
the FOVI accordingly. Make sure you select each telescope and make sure the
radio box ON is not checked (the software manual can provide additional
details) - only the RCOS Carbon 20” FOVI should be on:
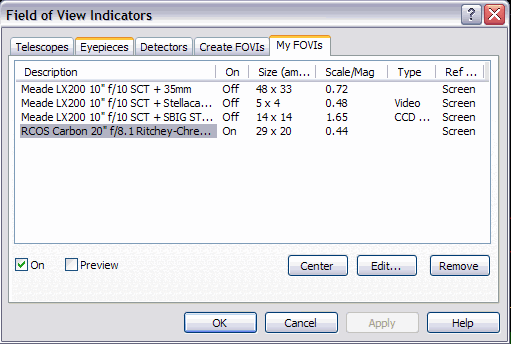
(Figure
27)
Next, use the find tool and enter the
equatorial coordinates (or common name if there is one). One of the obvious
radio targets on our list of radio sources is M84 – an elliptical galaxy that is
also a radio galaxy. In the Find box, I enter “M84”:
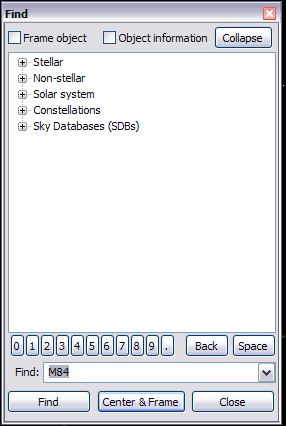
(Figure
28)
Click the CENTER & FRAME button to show
the target. The next step is to orient the field of view to match the CCD image
of the object area. Use the ROTATE TOOL for this:
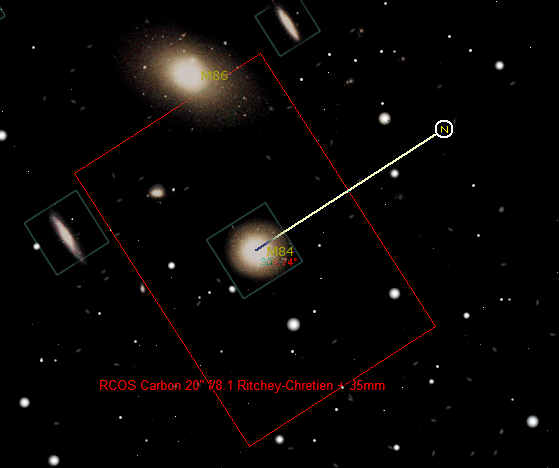
(Figure
29)
Click and drag the N (N means North)
upward:
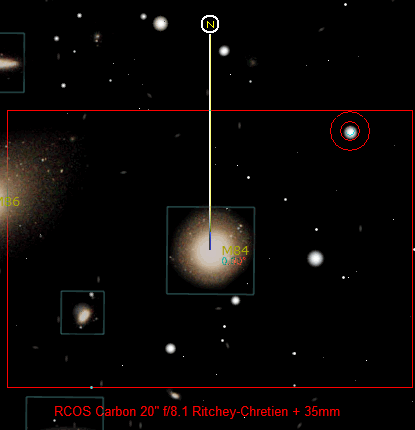
(Figure
30)
The field of view is now oriented with
the CCD image.
Next, choose some bright stars in the
field by clicking on it, like this one:
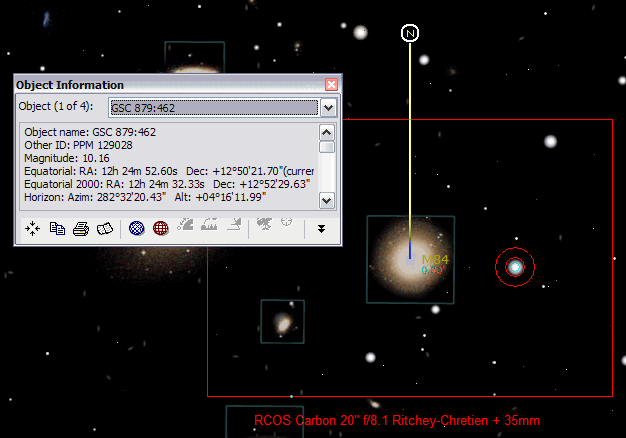
(Figure
31)
Note the OBJECT INFORMATION box has lots
of information, including the coordinates. This is important: make
sure you use the Equatorial 2000 coordinate set and not the “current” coordinate
set as listed in TheSky’s OBJECT INFORMATION box. The NVSS and FIRST sky
surveys (as well as a great many others) use the J2000 (Equatorial 2000)
coordinate standard. I learned my lesson when I entered the “current” coordinate
set and could not locate any targets – including M84!
It is best to have the calibrated image
open in Mira Pro and TheSky program running at the same time. I am lucky to have
a widescreen monitor so I can have both programs side-by-side; otherwise you can
ALT-TAB between programs. The process of astrometric calibration is pretty
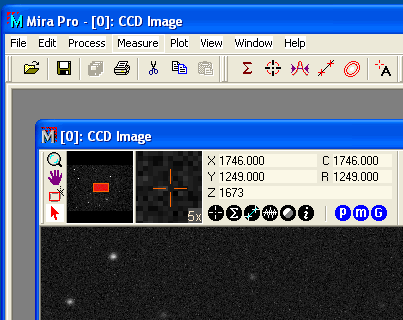
straightforward; with the image open in Mira Pro, notice the X and Y coordinates
(figure 32):
(Figure
32)
The cursor will translate to pixel
values in the X and Y axis. The Z axis remains the same as this is a 2D image.
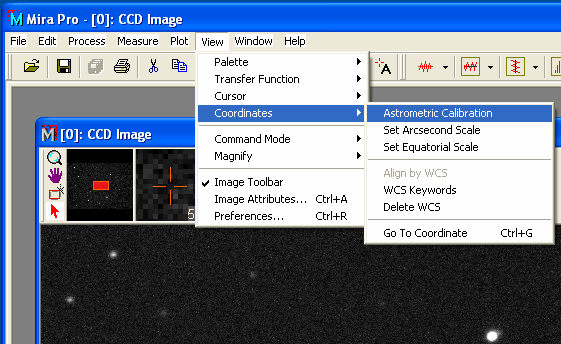
To begin calibration, activate the
ASTROMETRIC CALIBRATION command (figure 33):
(Figure
33)
Clicking on the ASTROMETRIC CALIBRATION
menu item will activate the function.
Switch back to TheSky and select a star
in the field that matches with the CCD image and note the equatorial 2000
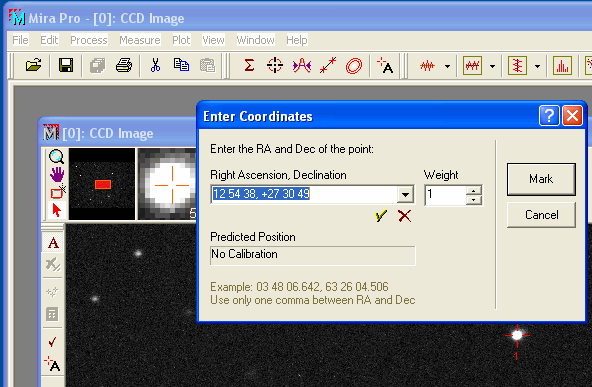
coordinates. Once you have this, switch back to Mira Pro and click on the
corresponding star, making sure the cursor is at the center of the star (note
the small preview window). A box opens (figure 34):
(Figure
34)
This is where you enter the coordinates:
Right Ascension first then Declination. In this example, the RA and Dec
coordinates are: 12h54m38s and +27o30’49”. You would enter this as:
12 54 38, +27 30 49 (note the spaces). Once entered, click the MARK button and
the box disappears. A mini spreadsheet opens confirming the point is set – click
the image again to move this spreadsheet window behind the image.
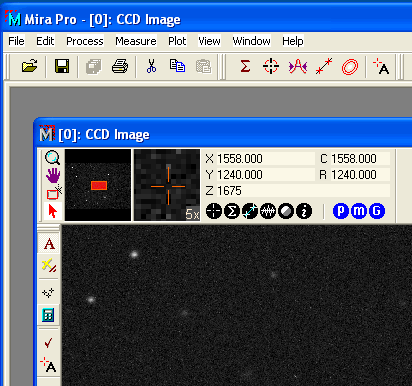
Repeat this for a total of at least 6
stars. Once all the points are marked, the calibration must be set (figure 35):
(Figure
35)
Click the CALCULATOR icon to the left of
the image to set the calibration. The final step is to save the image – this
saves the calibration to the FITS header in WCS format.
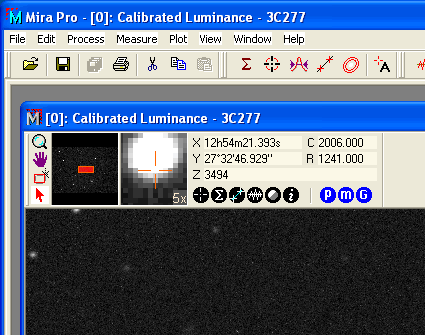
(Figure
36)
Once the calibration is set, notice in
the image above that the numbers in the X and Y fields are replaced by the RA
and Dec coordinates (figure 36). How cool is that!
In order to be accurate, Mira Pro
provides a summary once the calibration has been set. The summary looks like
this:
|
Astrometric Calibration for
E:\...\HET615\_3CR272.1 - M84\M84.FIT
Field Center:
RA: 12h24m50.944s at column 2004.000
Dec: 12°50'51.054" at row 1336.000
Plate Solution Errors:
RA rms: 0.4604 arcsec using 6 points
Dec rms: 0.4136 arcsec using 6 points
Image Scale:
X scale: 0.4556 arcsec/pixel
Y scale: 0.4560 arcsec/pixel
Rotation of the sky on the
image:
RA Axis: -9.3625 degrees.
Dec Axis: 170.0964 degrees.
WCS CD Matrix:
x0=0.000830104005 C_11=0.000120997048 C_12=-0.000021125216
y0=-0.000342961558 C_21=0.000019968335 C_22=0.000121110784 |
I am interested in the ‘Plate Solution
Errors’ section. I am unclear as to how this works, but the Mira Pro manual
suggests a value of 0.5 or less (the lower, the better). I did discover that if
the selection of a star is off-center a bit, the error is greater – so make sure
that the selected stars are centered in the cursor cross-hairs (this is what the
5x preview window is for – especially helpful for small stars).
In testing this method, I used the
coordinates of one of the radio sources – 3CR272.1, otherwise known as M84. This
object is fairly obvious in the image so I moved the cursor around the image to
locate 12h25m3.7s RA and +12d53m33s Dec:
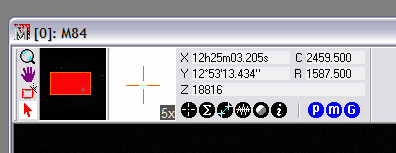
(Figure
37)
That bright object in the 5x preview
window is the (near) center of M84. Astrometric calibration is a success.
Each of the 8 images has undergone
astrometric calibration using the methods outlined above. Once the optical
counterparts are identified (some where rather dim), I used Mira Pro to mark the
target using the LABELS ( )
button. This image will be screen saved
as a normal image to demonstrate the location of the radio source. Saving the
image will not save the annotation. )
button. This image will be screen saved
as a normal image to demonstrate the location of the radio source. Saving the
image will not save the annotation.
Back to Top
13.
Object Identification:
With the coordinates of the radio object
identified, the CCD image should be resized to match the radio image size. The overlay
is a simple process, however there are a few pieces of data I need before
resizing my image. Image
resolution is not enough – I need to know the pixel scale. Knowing the pixel
scale (0.44) for my camera alone will provide nothing outside of guessing – and
that will take too long and will most likely be incorrect. The NVSS website does
not list the pixel scale of their images; however, the FIRST website does list
the pixel scale. At a value of 1.8 for the FIRST radio images, I can deduce two
things:
- Since I set the SkyView
image parameters based on the FIRST and NVSS images, they will
be extracted with the same image scale
- My images will need to be
reduced to 25% (50% in size when using 2x2 binning) –using the equation:
0.44/1.8 = 0.2444444444
The NVSS and FIRST surveys oriented
their data equatorially so that images are “extracted” from the virtual
celestial sphere. This is significant as my images were captured on an
equatorial mount. What does this mean? My images are oriented correctly with the
radio data – at least in theory. I will proceed with this assumption.
Knowing the orientation and scale of the
images, overlay is simply a matter of creating a composite image. Here are the
steps:
- Create a new RGB image (I
use PhotoShop)
- Select CCD Image and copy
(CTL+A then CTL+C)
- Select new image and paste
(CTL+V)
- With new image selected,
create new layer, select layer
- Switch to radio image and
copy (CTL+A then CTL+C)
- Select new image and paste
(CTL+V)
- In the layers palate,
change the opacity of the selected layer (should be the radio image), change
opacity to the CCD Image is visible underneath
- Select the Move Tool and
drag the radio image so the center of the image is over the discovered
coordinate location on the CCD image - guides and rulers help here
Once the image overlay is complete, the
image is now flattened (in the layers palate), cropped and saved.
When I examined the result of the
overlay, I discovered that the image quality was rather poor, and discernment of
details is rarely possible. One solution to this issue is to do a simple
side-by-side comparison with arrows marking the radio and optical sources. A
novel idea suggested by Professor Pamela Gay is to create an RGB image using the
three separate images: NVSS image as the Red channel, the CCD image as the Green
channel and the FIRST image as the Blue channel – or a variety of combinations.
The method I have chosen is a
side-by-side comparison. Arguably this is the most simple method, but has the
benefit of full view of each image; however, since the project defines an
overlay, I will also include an image with an overlay using the composite method
outlined above. This method provides better mixing of opacity through the
various layers within PhotoShop.
Back to Top
14.
Summary of Methods:
The details of methods used in this
project are vital, but rather long. The steps above can be summarized in
chronological order, so here is the project and methods in summary:
- Receive target list –
names of known radio sources
- Use NED to acquire the
coordinates of the radio source names
- Use the FIRST, NVSS and
SkyView database to enter coordinates and extract the radio image
- Determine the plate scale
of the image – assumed to be 1.8 according to data from FIRST website and
NVSS image scale
- Acquire time and log into
the Blackbird Observatory – the telescope I used to acquire the images (you
may have your own telescope)
- Enter the coordinates into
the telescope SLEW TO command and acquire images
- Download image and
reduction frames, reduce the images
- Use the GSC and USNO B
database base within TheSky to acquire coordinates of bright stars in each
of the images
- Use Mira Pro to
astrometrically calibrate the images using data from TheSky, save image
- Use Mira Pro to locate the
desired coordinates – locate optical counterpart of the radio source
- When located, use Mira Pro
to label the image – then screen save the image
- Using PhotoShop, resize
the image to match the scale of radio image – reduced to 25% for 1x1 bin
images and reduced to 50% for 2x2 bin images
- Create an overlay of the
CCD image and radio image using PhotoShop, or
- Create a side-by-side
comparison of the optical and radio objects, or
- Create an RGB image from
the CCD, NVSS and FIRST images
Luckily I had the right tools for the
job – that is I have in my arsenal an American Express card for purchase of
telescope time, TheSky Professional, MaxIm DL, Mira Pro and PhotoShop CS2. There
are probably methods available for those with limited resources, but this makes
me nervous thinking about it.
In the next section: objects. Each
individual target will be discussed including basic information, facts and imaging notes
will be covered. Following the next section will be a discussion on the
mechanisms of the AGN (Active Galactic Nuclei) and the FR (Fanaroff-Riley)
classification.
Back to Top
15. Objects:
16. 3C218:
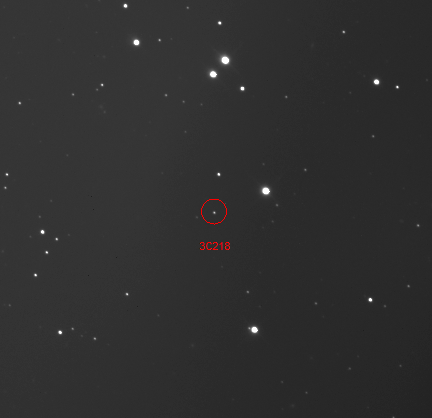
(Figure 38)
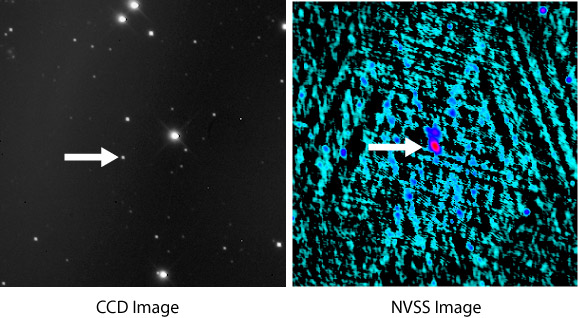
(Figure 39)
The object 3C218 carries the name Hydra
A. The designation ‘A’ means it’s the first (or most prominent) radio source in
the constellation Hydra. Hydra A is a very bright Fanaroff-Riley (FR) type I
radio galaxy (Lane
et al., 2004). While the NVSS data obscured the fine detail of this object,
more recent observations with higher resolution has determined an “S” symmetry
of the inner jets, possibly resulting from precession of the central engine (Lane
et al., 2004). The central engine of this radio galaxy is believed to be a
supermassive black hole.
Optically, this galaxy is a faint cD
type galaxy (elliptical galaxy) with an apparent magnitude of 14.8
(W8).
In addition, this cD galaxy is the dominant member of A780, a poor Abell cluster
of galaxies which lies at a distance corresponding to z=0.0549 (Lane
et al., 2004).
Imaging notes: this object was a bit of
a challenge for imaging as the object sets early in the evening and westerly
wind threatened the observatory resulting in a 30 to 50 degree closure of the
west panel. There were only two days I was able to target this area, one of
those days was poor weather resulting in loss of the guide star and trailing of
the stars in the image. The second image attempt was successful; however, light
contamination resulted in a gradient on the left side of the image (car,
neighbors light, or something similar possibly).
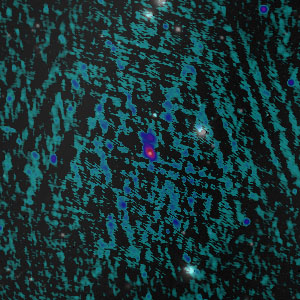
(Figure 40)
Figure 40 is a composite of the CCD
Image and NVSS Image. There is no FIRST radio image of this object.
Back to Top
17. 3C273:
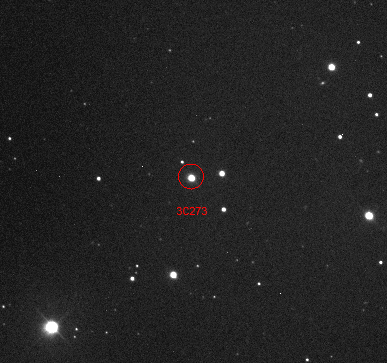
(Figure 41)
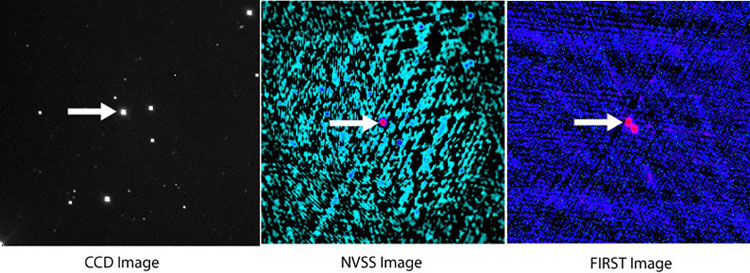
(Figure 42)
Object 3C273 is a well-known quasar
discovered early during initial radio surveys. Its distance corresponds to a
z=0.158 (Stawarz,
2004) and has a visual magnitude of 12.8 (W8).
Radio occultation by the Parkes 64 meter dish identified this object as the
first detected quasi-stellar object, or QSO (Burke
and Graham-Smith, 2002). What is interesting about this object is its
one-sided jet, demonstrated by super luminal motion with the counter-jet
discovery being a controversial issue. Regardless, the core-dominated
non-thermal emission of the one jet is still believed to be driven by a central
engine, the AGN core. The one-sided view of this object is most likely due to
its orientation to Earth.
Imaging notes: a faint aircraft or some
other faint object has streaked across the lower portion of the image. The area
of interest is unaffected.
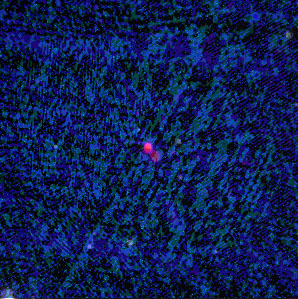
(Figure 43)
Figure 43 is a composite of the CCD
Image, NVSS Image and FIRST Image.
Back to Top
18. 3CR270.0:
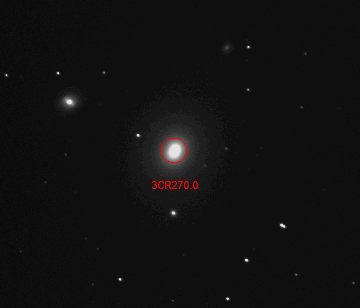
(Figure 44)
(Figure 45)
Object 3CR270.0 is also known as NGC
4261 (W8),
an elliptical galaxy – one of the twelve bright members of the Virgo cluster of
galaxies. The radio source of this galaxy is low-luminosity non-thermal emission
from an AGN core. While categorized as an FR I BL Lac object, Hubble Space
Telescope and Chandra data indicate a very hot and very large accretion disk
surrounding a massive black hole (Chiaberge
et al., 2003) with large jets. The radio jets are also symmetric on both
axes.
According to the NED database (W8),
NGC 4261 has a visual magnitude of 10.4 and is at a distance corresponding to
z=0.0075.
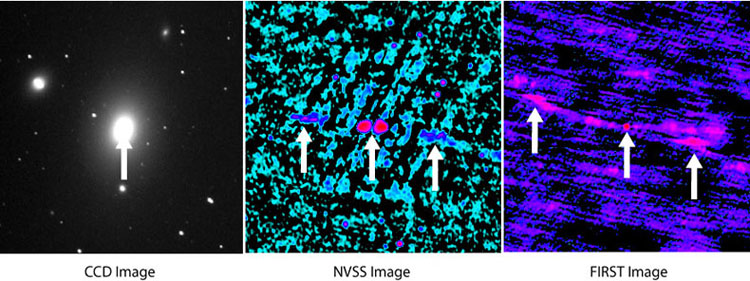
Figure 45 demonstrates the extensive jets in the radio image – indicated by
the arrows in the NVSS and FIRST images.
Image notes: imaging of NGC 4261 was
uneventful. Many smaller galaxies are visible in the field of view – the smaller
members of the Virgo cluster. A much longer exposure would bring out the details
of these smaller galaxies.
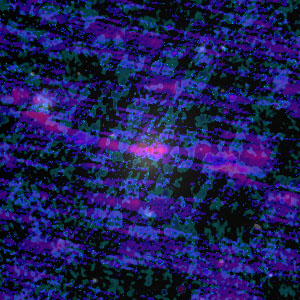
(Figure 46)
Figure 46 is a composite of the CCD
Image, NVSS Image and FIRST Image.
Back to Top
19. 3CR272.1:
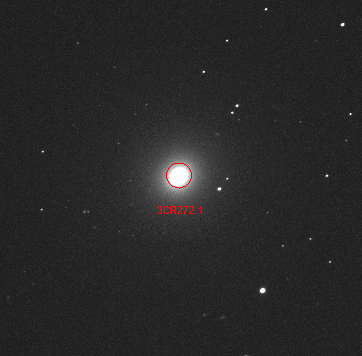
(Figure 47)
(Figure 48)
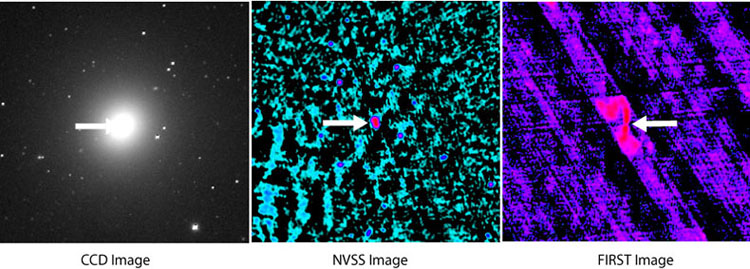
3CR272.1 is also known as 3C272. In
addition, this object is the familiar elliptical galaxy M84 – member of the
Virgo cluster of galaxies. This object is the closest galactic radio source of
this group of targets, with a z=0.0354 and shines with a visual magnitude of 8.7
(W8).
The radio source of this object is also non-thermal synchrotron radiation
powered by a massive black hole. However, unlike other galaxies like this, the
radio jets are much smaller and angular. It is suggested the material that is
emitting the radio emission is also dense enough to affect the orientation of
the jets as well as the orientation of the central engine causing a precession
of the core (Quillen
and Bower, 1999).
Imaging notes: imaging of M84 was
uneventful. Just like NGC 4261, M84 is a member is a galaxy cluster.
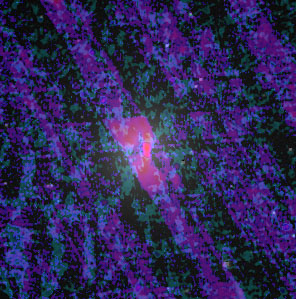
(Figure 49)
Figure 49 is a composite of the CCD
Image, NVSS Image and FIRST Image.
Back to Top
20. 3C277.3:
(Figure 50)
(Figure 51)
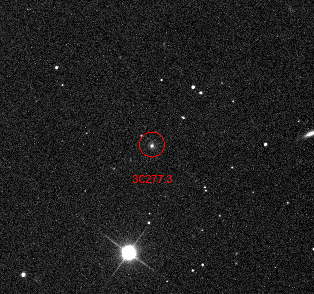
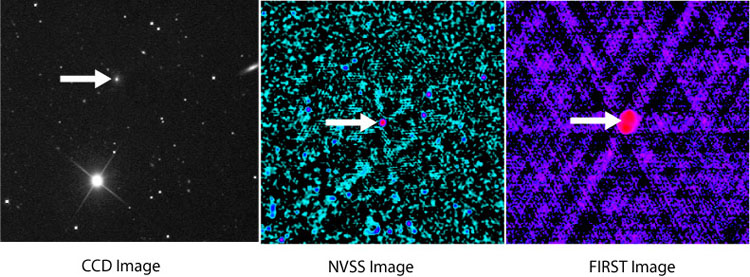
Object 3C277.3 is also known as Coma A.
This dominant radio source in the faint Coma cluster resides at a distance of
z=0.085336 with a visual magnitude of a faint 15.9 (W8).
Coma A is classified as an FRII type radio galaxy with the engine being typical
of radio galaxies – a supermassive black hole (Morganti
et al., 2002). While the core of a radio galaxy is thrilling enough, what
makes this galaxy a bit more special is its proximity to us – meaning that it’s
pretty close. This allows detailed views with spectroscopy and the Hubble Space
Telescope. It’s not the core that is its fame, but its optical emission of the
radio source – that is, emission lines have been detected in the optical
wavelengths from the lobes of the radio jets (Miley
et al., 1981). Also, absorption lines have been detected in the optical
wavelengths as well, indicating that the jets are extending into a large gas disk
surrounding the galaxy (Morganti
et al., 2002).
Imaging notes: Imaging of Coma A was
uneventful. Compared to the other images, the star field is not as full and the
galaxy distribution of this cluster is minimal. This object was at the lower
edge of the main cluster.
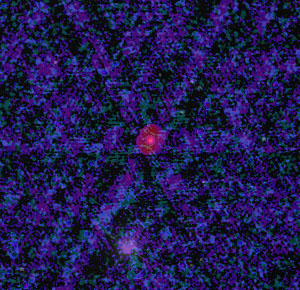
(Figure 52)
Figure 52 is a composite of the CCD
Image, NVSS Image and FIRST Image.
Back to Top
21. 3C405:
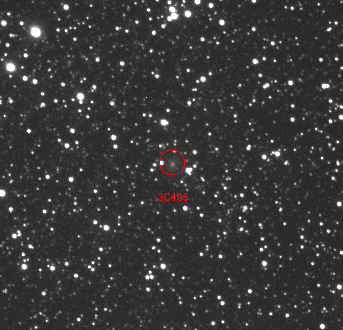
(Figure 53)
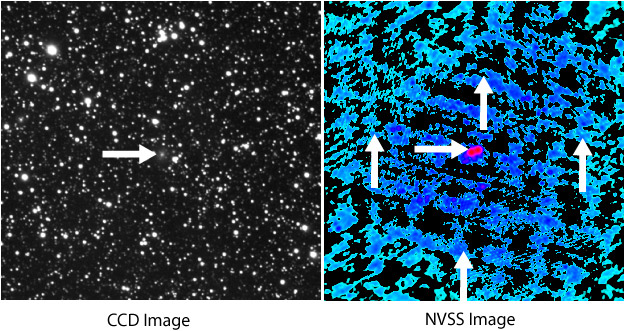
(Figure 54)
Object 3C405 is also known as Cygnus A –
a very powerful radio source at a relatively close distance, z=0.0561 (W8).
Optically, the object has a dim visual magnitude of 16.2 (W8).
The galaxy itself is very bright in
the radio spectrum. In addition, the engine driving the emission is thought to
be pointing near our line of site as indicated by the presence of the Broad-Line
Region emission (BLR) – the same emission driving quasars (Thornton,
Stockton and Ridgway, 1999). Cygnus A, being one of the brightest radio
source in the sky, is classified as an FRII type radio galaxy (Burke
and Graham-Smith, 2002).
The NVSS image in figure 54 demonstrates
the extent of the radio emission (red is bright, blue is not as bright) as
indicated by the arrows.
Imaging notes: Cygnus A was a low target
towards the east. Imaging of this target was uneventful, but had to be done late
in the evening. This image is rather dramatic as the field is closer to the
Milky Way band, resulting in a rather intense star field.
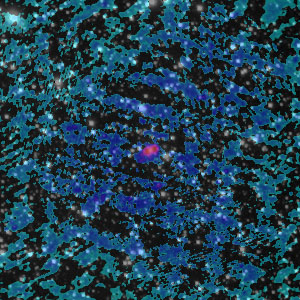
(Figure 55)
Figure 55 is a composite of the CCD
Image and NVSS Image. There is no FIRST radio image of this object.
Back to Top
22. 3CR348:
(Figure 56)
(Figure 57)
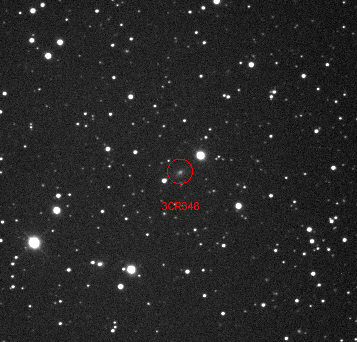
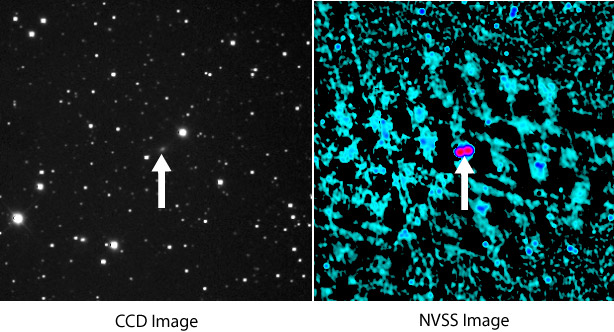
Object 3C348 is also known as Hercules
A. This object is the faintest on our list with a visual magnitude of 18.25. It
is also fairly distant compared to the other objects on our list, corresponding
to a z=0.154 (W8).
Hercules A is neither an FR I nor II type radio source. In fact, it is one of the
few double-lobe radio sources and the only radio source that feature a double
optical core (Sadun
and Morrison, 2002). According to
Sadun and Morrison (2002), the Hubble Space Telescope clearly identifies two
galaxies, one is the AGN source – Hercules A and the other is a galaxy that does
not emit in the radio. The presence of this second galaxy does not seem to
affect, add or subtract anything from Hercules A. As such, the existence of this
double-core object is a bit of a mystery, but it’s possible that this radio
powerful, double-cored galaxy is the sum of a previous galaxy interaction.
Imaging notes: imaging of Hercules A was
uneventful. While the star field is somewhat rich, the area of interest is
faint.
(Figure 58)
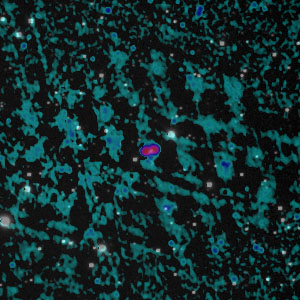
Figure 58 is a composite of the CCD
Image and NVSS Image. There is no FIRST radio image of this object.
Back to Top
23. 3C461:
(Figure 59)
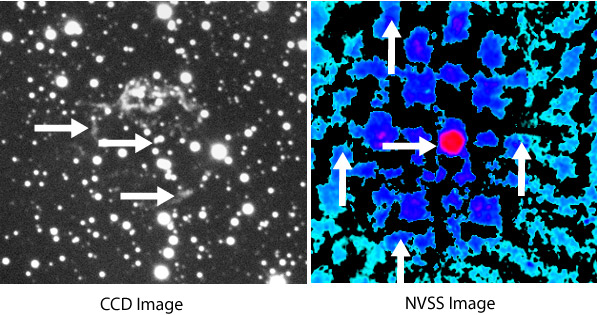
(Figure 60)
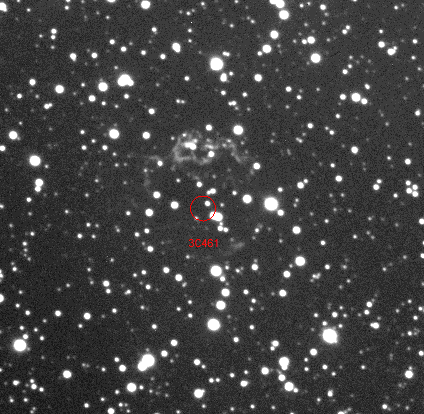
3C461 is the only radio source on our
list that is not a galaxy. Also known as Cassiopeia A, the optical counterpart
was not noticed until bright radio emissions brought it to light (so to speak) –
in fact, Cassiopeia A is the brightest radio object in the Northern Hemisphere (Fesen,
2001). Cassiopeia A is the youngest supernova remnant in our galaxy, which
occurred some 300 years ago. The expanding shell is traveling at 6,000 km/second
and colliding with the Interstellar Medium. It is this collision that emits
synchrotron radiation visible at radio frequencies. If all goes well, emission
from this object should continue for another 100,000 years with a gradual
decrease in radio emission (Burke
and Graham-Smith, 2002).
The NVSS image in figure 60 demonstrates
the extent of the radio emission (red is bright, blue is not as bright) as
indicated by the arrows.
Imaging notes: This object was also
difficult to image as the object was low in the horizon. This object was imaged
in only one night – weather interfered with the rest of the imaging nights. In
addition, the nebulosity is very faint resulting in 2x2 binning of the CCD to
get good detail in a 15 minute exposure.
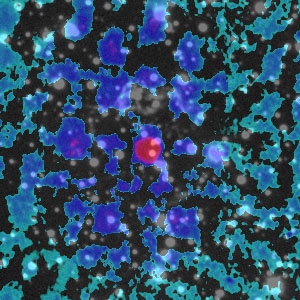
(Figure 61)
Figure 61 is a composite of the CCD
Image and NVSS Image. There is no FIRST radio image of this object.
Back to Top
24.
Discussion:
This project included eight radio
targets – seven of them from galaxies and one from a supernova remnant. The
radio emission from the galaxies has one thing in common, the central engine
providing the source of the emission. The radio images that were acquired were
from the 3C and 3CR (Third Cambridge Revised catalog) surveys, a radio survey
that detected 320 extragalactic radio sources (Burke
and Graham-Smith, 2002).
These galaxies have been separated into
two classes based on the presence of radio emission strength and orientation.
This classification is called Fanaroff & Riley. An FR I galaxy is one that emits
lower power radio emission and do not feature hot spots - strong central
emission without prominent radio lobes. FR II type radio sources have prominent,
supersonic jets that emit their radio emission primarily from the lobes
“hot-spots” (Burke
and Graham-Smith, 2002).
Jets emanating from the core of the
galaxy carry with it particles that are caught up into magnetic fields. This
non-thermal radio emission is from these energetic particles moving through the
magnetic field (Sparke
and Gallagher, 2000), or synchrotron radiation. At first, it was thought
there were several varieties of active galaxies:
- Quasars
- BL Lac Objects
- Seyfert Galaxies
- Radio Galaxies
It is now widely accepted that all of
these types of galaxies are really powered by the same engine – a supermassive
black hole. The single group that covers all radio galaxies is Active Galactic
Nuclei, or AGN (Sparke
and Gallagher, 2000). The AGN model states that depending on the orientation
of the galaxy core, the object will emit a different type of radiation (toward
the observer) and
therefore will appear to be a different object.
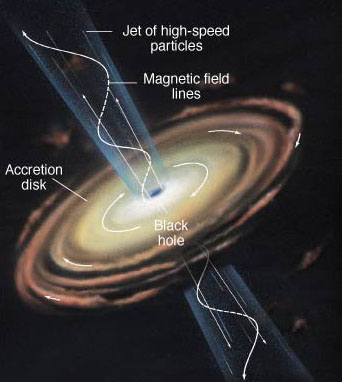
(Figure
62)
Figure 62 demonstrates the AGN of a galaxy. A BL Lac object, for example,
will have the AGN facing us so we are looking directly at the jets. This will
appear to make a BL Lac object a very strong radio source and one of the
brightest phenomena in the Universe. As the orientation changes, the object
will appear to look different – like a Seyfert galaxy or quasar (looking at an
angle) or a “simple” radio galaxy (looking at the edge of the accretion disk).
At the heart of an AGN is a very large
black hole – a supermassive black hole. Material is caught in the black hole's
intense gravitational field forming an accretion disk, generating intense heat.
Some material is dragged along the intense magnetic fields, directed away from
the black hole. As seen in
figure 62, the magnetic field lines are perpendicular to the accretion disk.
Energetic particles are funneled through the magnetic field and the result is
the jets emanating from the core. Sometimes there are two sources of energy:
the particles themselves emit synchrotron radiation, but supersonic particles
can impact the ISM and create a “hot-spot” that also emit synchrotron radiation.
The only non-galaxy object is Cassiopeia
A, a supernova remnant. This used to be a high mass star; these large hot and
bright stars do not last very long –only about 106 years. In these
stars, hydrogen fusion gives way to helium fusion as the hydrogen runs out -
then helium to carbon, carbon to oxygen, then oxygen to silicone. The final
stage occurs when silicone fuses to iron. Iron cannot fuse so when it tries, the
star blows itself apart in a supernova. All of the stellar debris is blasted out
at about 6,000 - 10,000 km/s in an expanding shell of debris. This debris does two things,
it seeds the surrounding interstellar medium (ISM) with heavy elements (W10)
and impacts the ISM creating emissions of synchrotron radiation. The source of
the magnetic field lines to create this emission is from the residual stellar
core – a neutron star [W11].
Finally, a summary table:
|
Object: |
Common Name: |
Visual Magnitude: |
F-R Type |
Special Feature: |
|
3C218 |
Hydra A |
14.8 |
I |
‘S’ symmetry of jets, possible
core precession |
|
3C273 |
|
12.86 |
|
One of the first discovered
quasars – one-sided jet |
|
3CR270.0 |
NGC 4261 |
10.4 |
I |
Symmetric radio jets, large
accretion disk |
|
3CR272.1 |
M84 |
8.67 |
I |
Smaller jets, possible core
precession |
|
3C277.3 |
Coma A |
15.94 |
II |
Emission lines from radio lobes
detected in optical wavelength |
|
3C405 |
Cygnus A |
16.22 |
II |
Brightest Radio Source, BLR
Emission |
|
3CR348 |
Hercules A |
18.25 |
I or II? |
Double optical core, double-lobe
radio source |
|
3C461 |
Cassiopeia A |
|
Not a galaxy |
The only supernova remnant in
our group |
Back to Top
25. Summary:
Supernova remnants and AGN’s are strong
emitters in the radio spectrum. Radio surveys like the 3CR (using the NVSS and
FIRST survey) have identified a variety of radio galaxies. Tools like these
radio surveys are vital in identifying some objects, for example Cassiopeia A
was discovered by a radio survey as its optical emission is quite faint. In
addition, some objects that look like stars are actually very distant galaxies called quasars. Studies
of galaxies and supernova using radio and optical emission allow us to better
understand the emission process as well.
Radio galaxies are subset of active
galaxies in a class known as Active Galactic Nuclei (AGN). Quasars, Seyfert
galaxies, BL Lac objects and radio galaxies are all AGN’s. The source of radio
emission is the acceleration of charged particles through magnetic fields
generated by a supermassive black hole – called non-thermal synchrotron
radiation. For FR II type galaxies, an additional radio source is the result of
supersonic jet lobes impacting the Interstellar Medium (ISM). The supersonic
velocity of charged particles in the supernova remnant also impacts the ISM
emitting synchrotron radiation.
This project demonstrates that amateur
astronomers can do some real science with amateur class equipment. For example,
a telescope with an aperture of 8 inches can reach a visual limiting magnitude
of 14 – and a CCD camera attached to the telescope can go deeper than this. There is a host of
data available online so all you need is a computer with an Internet connection
and an object name. Sources like the
NASA SkyView, FIRST or NVSS surveys (as well as
MAST) can provide the rest.
This project was extremely fun. It
should be noted that astrophotography can be extremely addicting so proceed with
caution. I would like to thank Ron Wodaski for his tireless efforts in making
sure the telescope was accessible. In addition, I would like to thank Josch
Hambsh, R. Jay GaBany and Ken Levin (the new owners of the telescope) for
adjusting their schedules to allow me to image my targets – or for helping me
image when I had difficulties.
And finally I must thank Professor Pamela Gay for her much
appreciated guidance and patience.
Back to Top
26.
References:
Becker, Robert;
White, Richard and David Helfand. “The VLA’s FIRST Survey.” PASP, 1997.
Burke, Bernard F.
and Francis Graham-Smith. An Introduction to Radio Astronomy. Second Edition.
Cambridge University Press, 2002.
Chiaberge, Marco
et al.”What do the Hubble Space Telescope and Chandra Tell Us About the Jet and
the Nuclear Region of the Radio Galaxy 3C 270?” ApJ, 582:645-653. January 10,
2003.
Condon, J.J.,
Cotton, W.D., Greisen, E.W., Yin, Q.F., Perley, R.A., Taylor, G.B. & Broderick,
J.J. “The NRAO VLA Sky Survey.” 1998, AJ, 115, 1693.
Fesen, Robert. “An
Optical Survey of Outlying Ejecta in Cassiopeia A: Evidence for a Turbulent,
Asymmetric Explosion.” ApJ, 133:161-186. March 2001.
Kutner, Marc L.
Astronomy. A Physical Perspective. Second Edition. Cambridge University
Press, 2003.
Kitchin, C.R.
Astrophysical Techniques. Third Edition. Institute of Physics Publishing,
Bristol. 2002.
Lane, W.M. et al.
“Hydra A at Low Radio Frequencies.” ApJ, 127:48-52. January 2004.
Miley, George at al.
“Optical Emission from the Extended Radio Source 3C 277.3 (Coma A).” AJ,
247:L5-L9. July 1, 1981.
Morganti, R. et
al. “Large-scale gas disk around the radio galaxy Coma A*.” Astronomy &
Astrophysics, 387:830-837. 2002.
Quillen, A.C. and
Gary Bower. “M84: A Warp Based by Jet-Induced Pressure Gradients?” ApJ,
522:718-726. September 10, 1999.
Sadun, Alberto and
Philip Morrison. “Hercules A (3C 348): Phenomenology of an Unusual Active
Galactic Nucleus.” ApJ, 123:2312-2320. May 2002.
Sparke, Linda S.
and John S. Gallagher. Galaxies in the Universe. An Introduction.
Cambridge University Press, 2000.
Stawarz, Lukasz.
“On the Jet Activity in 3C 273.” ApJ. 613:119-128. September 20, 2004.
Thornton, Robert;
Stockton, Alan and Susan Ridgway. “Optical and Near-Infrared Spectroscopy of
Cygnus A.” AJ, 118:1461-1467. October 1999.
Back to Top
27.
Website and Images References:
The NVSS Sky Survey Homepage
The VLA FIRST Survey Homepage
NASA SkyView Home Page
[W1] Keck Observatory:
http://www.keckobservatory.org/
[W2] NASA:
http://imagine.gsfc.nasa.gov/docs/science/know_l1/emspectrum.html
[W3] NASA:
http://www.nasa.gov/centers/langley/science/FIRST.html
[W4] MIT Haystack:
http://web.haystack.mit.edu/urei/tut3.html
[W5] NRAO:
http://www.nrao.edu/whatisra/hist_reber.shtml
[W6] NRAO:
http://www.nrao.edu/whatisra/hist_jansky.shtml
[W7] VLA:
http://www.vla.nrao.edu/genpub/overview/
[W8] NED:
http://nedwww.ipac.caltech.edu/
[W9] AGN Model:
http://physics.uoregon.edu/~courses/BrauImages/Chap25/FG25_011.jpg
[W10] Chandra:
http://chandra.harvard.edu/press/99_releases/press_122199.html
[W11] Chandra:
http://chandra.harvard.edu/photo/2004/casa/
Back to Top
28. Figures:
Figure 1:
http://www.nrao.edu/whatisra/hist_jansky.shtml
Figure 2:
http://www.nrao.edu/whatisra/hist_reber.shtml
Figure 3:
http://imagine.gsfc.nasa.gov/docs/science/know_l1/emspectrum.html
Figure 4:
http://www.nasa.gov/centers/langley/science/FIRST.html
Figure 5:
http://web.haystack.mit.edu/urei/tut3.html
Figure 6:
NRAO / AUI /
NSF
Figures 7 and 8:
http://nedwww.ipac.caltech.edu/
Figures 9 and 10:
http://www.cv.nrao.edu/nvss/
Figures 11 and 12:
http://sundog.stsci.edu/
Figures 13 and 14:
http://skyview.gsfc.nasa.gov/cgi-bin/skvadvanced.pl
Figures 15 to 25:
http://www.bb-obs.com/
Figures 26 to 31:
TheSky 6 Professional
Figures 32 to 37:
Mira Pro version 7.61
Figures 38 to 61: Core project images
from FIRST, NVSS and me – processes with MaxIm DL, Mira Pro, PhotoShop CS2 and
Illustrator CS2
Figure 62:
http://physics.uoregon.edu/~courses/BrauImages/Chap25/FG25_011.jpg
Back to Top |

