|
Color Magnitude Diagram of Cluster M67 - by Tim Hunter:
Back to
Astrophotography
Tim Hunter is a classmate of mine, and owner/operator of
two fine observatories in Arizona - the 3 Towers Observatory and the Grasslands
Observatory. His project on M67 is similar to mine but special in that instead
of using provided data he decided to use his own. His project highlights how he
captured his own science images and used them to create a color magnitude
diagram of M67.
Abstract
Introduction
Equipment and Observations
Results
Discussion
Conclusion
References
Abstract
Color magnitude diagrams (CMD’s) of the open cluster M67
(NGC2682) were constructed from data obtained with a Meade LX200 12-inch
telescope at the 3towers Observatory in Tucson, Arizona, and from data obtained
with the 24-inch f/5 telescope at the Grasslands Observatory near Sonoita,
Arizona. The CMD’s plots V magnitudes versus B-V color indices and R magnitudes
versus B-R color indices for selected stars in the cluster. The diagrams
obtained generally fit published data.
Back to Top
| Back to
Astrophotography
Introduction
M67 is a well studied open cluster (Gilliland, Nissen,
Sanders, Sandquist). It was discovered by Messier in 1780, though there is
evidence that it was observed earlier by Johann Gottfried Kohler (Archinal,
2003). M67 is visible to the unaided eye at a dark sky site. Archinal and
Hynes (2003) consider M67 to be an unusual cluster in many respects. It lies
far from the Galactic plane, and it is fairly large and spread out. One could
conclude it is either close by and still near the Galactic disk where it formed,
or it is quite old and has traveled around the Galaxy many times. If it is old
and has traveled around the Galaxy, it has probably been perturbed into an orbit
above the Galactic disk far from where most open clusters are found. This has
allowed M67 to age gracefully without much disturbance.
The present project consists of the construction of color
magnitude diagrams (CMD’s) for M67 using amateur observatories and imaging
equipment. The CMD’s and their accompanying data are compared with professional
data, and their limitations discussed. Also, the CMD’s and their data are used
to make reasonable inferences about M67’s distance and age. Is M67 close and
young, or is it far away and old?
Back to Top
| Back to
Astrophotography
Equipment and Observations
The 3towers Observatory is located in the Catalina
foothills five miles north of the center of Tucson, Arizona, at an altitude of
2600 feet (792 meters). It contains a Meade 12-inch LX200 telescope, an Apogee
AP7 CCD camera (thin, back-illuminated SITe 512 x 512 24 micron chip), and an
ISIS FW-1 filter wheel with Johnson-Cousins R, V, B, I, and Clear parfocal
filters (Hunter, #1). The CCD field of view is 21.7 arcminutes, having 2.5
arcseconds per pixel.
Images of M67 and two Landolt Standard Fields were obtained
on 23 March 2004, a clear night with slight haze in the Eastern sky with no
visible haze near the location of M67 or the standard stars used for the
project. A series of five bias, and five 60-second dark images were taken just
prior to imaging M67. The CCD camera operated at a temperature of -350
C for all images. The bias and dark images were each median combined to
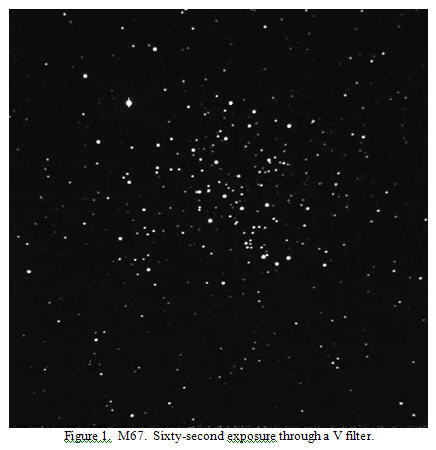
produce master dark and master bias frames. The images of M67 consisted of
60-second exposures through V, B, and R Johnson-Cousins photometric filters. An
example of one of the images is shown in figure 1:
Flat frames for each color were obtained after the
individual color frames of M67 were taken. The LX200 Meade telescope has
considerable “mirror flop”, and the most accurate flat images are obtained by
placing a translucent plastic cover over the corrector plate and exposing the
sky for several minutes at the exact location of the telescope used for the data
images. The images of M67 were taken with the object having an air mass of 1.07
for the B and R images and 1.10 for the V image.
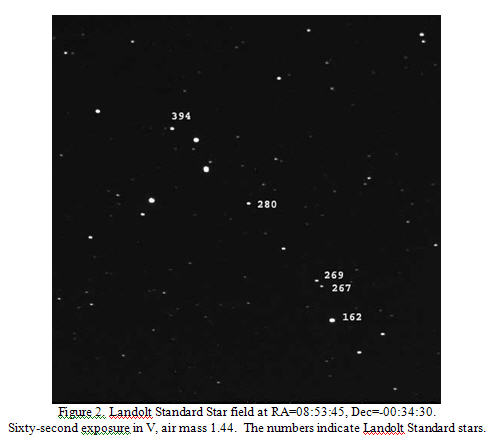
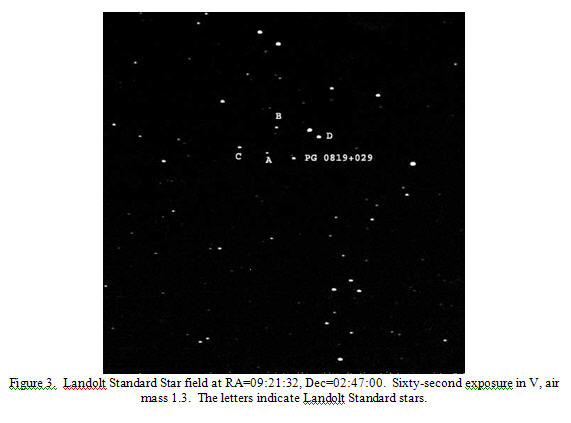
Two Landolt Standard Star fields were imaged. They were
chosen from the WIYN CCD database of Standard Fields (Smith, 1998). The fields
were the one’s closest to M67, and they had an air mass of 1.44 and 1.30 at the
time of their observations. They were centered at RA = 08:53:45, Dec = -
00:34:30 and RA = 09:21:32, Dec = 02:47:00, respectively. Figure 2 and 3
illustrate V images from these fields:
The M67 data image in each color and the Landolt Standard
Star images were calibrated by MaxIm DL/CCD using the master bias, master dark,
and flat images for each color (Diffraction Ltd, 2003). The calibration used
auto dark frame scaling and was applied to the flat images. MaxIm DL/CCD was
chosen for the calibration, because it was the software used to control the
Apogee AP7 CCD camera (Apogee, 2004).

The photometric zero points in each case were obtained by
equal weighting of the five Standard Stars in each field. Mira Pro 7.0 (Axiom,
2004) was used to use measure these standard fields as well as the V, B, and R
data images of M67. The aperture photometry tool was set to the Mira default
settings, using a target radius of 7 pixels with sky background annulus radii
set to 20 and 25 pixels for all measurements. The full width half maximum (FWHM)
for the V M67 image was 2.4 pixels.
A color image of M67 was created using the separate images in B, V, and R.
One hundred nine stars in this image were labeled for ease of identification
during photometric measurement of the separate color images. The stars chosen
for labeling and subsequent photometric analysis were predicted by Sanders
(1977; 1989) to have a greater than 50% probability of being members of M67.
Figure 4 illustrates these stars:
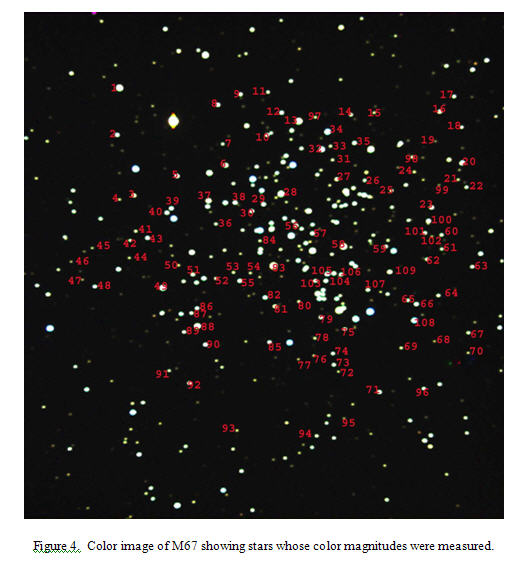
A total of 109 stars were originally selected for measurement. Twenty-four
of these stars are either double or sufficiently close to other stars that more
than one star was included in the photometry aperture. These stars were
eliminated from measurement, and a total of 85 M67 stars were then measured on
the individual V, B, and R images. The Guide Star Catalog (GSC) and the Sanders
(1977) listings for these stars are shown in Sheet 1 of the Excel attachment
3towersM67ColorMagDiag.xls.
The photometric zero points chosen for the Mira Pro 7.0 measurements of the
M67 images were linearly extrapolated from the photometric zero points for the
Landolt Standard fields and are as follows:
M67 V (air mass 1.10) – 18.864; M67 B (air mass 1.07) – 18.731; M67 R (air
mass 1.07) – 18.766.
Note: the Landolt Standard field photometric zero point for B actually
decreased from 18.675 at air mass 1.44 to 18.471 at air mass 1.3! This is hard
to explain, and it is assumed that when the B image of the Landolt Standard
field at air mass 1.3 was being exposed, an unnoticed cirrus cloud passed over
the field reducing the photometric limiting magnitude. A photometric zero point
for B for M67 at air mass 1.07 was extrapolated from the relationships between
the photometric zero points for B, V, and R at the Landolt Standard field at air
mass 1.44.
Air mass corrections were calculated for V and R, using the following
formulae (V illustrated):
mV- V = + x1V + x3V
´ 1.3, for Landolt Standard Field at
air mass 1.3
mV-V = + x1V + x3V
´ 1.44, for Landolt Standard Field at
air mass 1.44
x1V = constant offset
term; x3V = air mass correction term
In the case of each color, V, B, or R, there are two equations and two
unknowns. Solving these equations for V and R gave air mass corrections of
0.166 for V and 0.164 for R. No air mass correction could be obtained for B,
because the data points for B values of the Landolt field at air mass 1.3 are
suspect. This term was set at 0.25. This value was selected from examining a
number of references listing air mass correction values for Kitt Peak National
Observatory near Tucson (Everett, 2001; Romanishin; Walker). It represents a
best guess estimate for the actual air mass correction for the 3towers site
which has nearly the same desert conditions as Kitt Peak, though it is at a
lower altitude.
Initial review of the CMD’s produced from the data on these
85 stars gave a somewhat sparse graph making recognition of a definite cluster
trend difficult (see below Results). As a consequence, photometric data was
then gathered on another 265 stars in the M67 field. This was closely examined,
and 223 of the 265 stars were carefully selected for measurement based on their
probability of being members of M67 (Sanders, 1977).
Next, data from the Grasslands Observatory was examined.
On 19 March 2004, four days before the formal initiation of this project, M67
was imaged at the Grasslands Observatory through V, B, and R filters using the
24-inch f/5 telescope at the observatory (Hunter, #2). A Finger Lakes
Instrumentation Dream Machine CCD (1024 x 1024, 24 micron thin, back-illuminated
SITe chip) was used with a CFW-1 Color Filter Wheel containing Johnson-Cousins
photometric filters (Finger Lakes). Exposures were 60-seconds V, 90-seconds B,
and 30-seconds R. The CCD field of view was 28 arcminutes, having 1.8
arcseconds per pixel. The FWHM for the M67 V image was 2.7 pixels. The air
mass for M67 was 1.1.
The R image was discarded for photometry due to partial
cloud cover when the image was taken. The images were calibrated using standard
Bias, Dark, and Flat Field images routinely used at the Grasslands Observatory.
Unfortunately, no Landolt Standard fields were obtained with the M67 images.
The results for the selected 85 stars measured at the 3towers Observatory was
used to characterize the photometric zero points for the Grasslands V and B
images. The Grasslands CCD camera operated at a temperature of -350
C for all images, and the software controlling the camera and the software
techniques used for the photometric data measurements was the same as used for
the 3towers Observatory data.
Back to Top
| Back to
Astrophotography
Results
The raw Mira Pro 7.0 data for this project for the stars in M67 is contained
in the attached Excel files, 3towersMiraRawData.xls and
GrasslandsMiraRawData.cvs. These data sheets include information on the
net counts, errors, and signal to noise ratios for the individual star
measurements.
3towers Observatory Results
The instrumental
and corrected photometric results for this project are shown in the attached
Excel file 3towersM67ColorMagDiag.xls. Sheet 1 delineates
the original 85 stars measured, the Sanders (1989) star number for each star,
and the Guide Star Catalog (GSC) listing for each measured star. The
instrumental and corrected V, B, and R magnitudes for each star are shown as are
calculated B-V and B-R color indices for each star. Column H calculates the
difference between the V magnitudes of Sanders (1989) for each star versus the V
magnitudes obtained for this project. The average difference between the
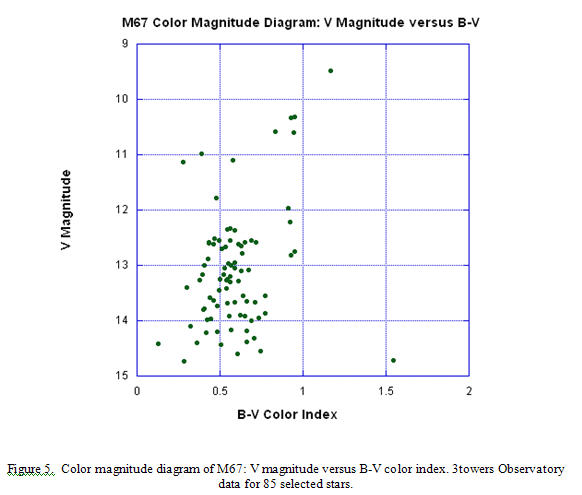
Sanders and Hunter V magnitudes is 0.23. Figure 5 represents the color
magnitude diagram of M67 for these 85 stars showing V magnitude versus B-V color
index.
Sheet 2 shows data for the additional 265 stars from the M67 field.
These stars were selected at random, while sheet 3 shows data for 223
stars specifically selected because they meet Sanders 1977 criteria for a
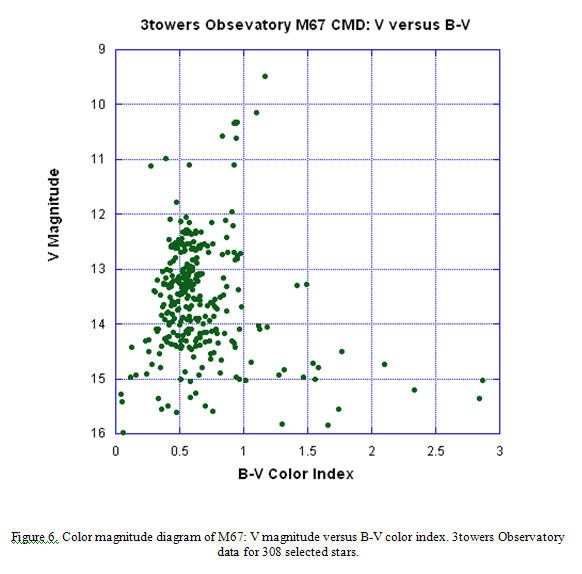
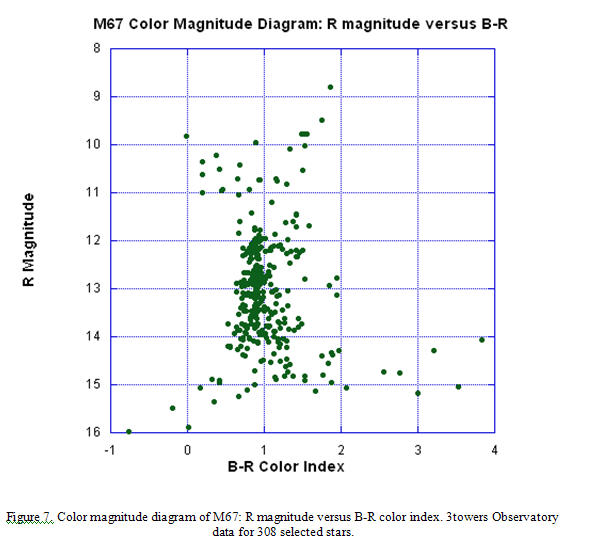
greater than 50% probability of being members of M67. When the data for these
stars is combined with the data for the 85 stars originally selected and
measured, new color magnitude diagrams were produced showing V magnitude versus
B-V color index (figure 6) and R magnitude versus B-R color index (figure 7).
Grasslands Observatory Results
The Finger Lakes
Instrumentation CCD camera at the Grasslands Observatory has 4 times the area of
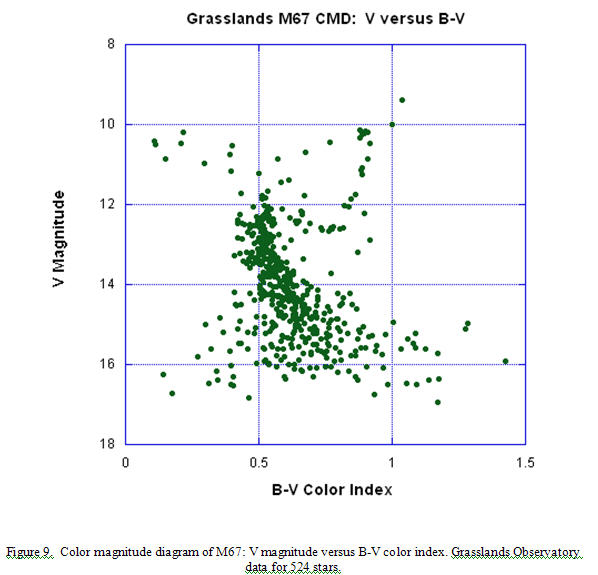
the Apogee AP7 camera at the 3towers Observatory. Five hundred twenty-four
stars were measured on the Grasslands images. The photometric results for this
data is shown in the attached file, GrasslandsM67Data.xls. The
instrumental photometric V and B zero points for the Grasslands data were
determined by taking the corrected magnitudes for Hunter stars 1-8 in the
3towers Observatory data and using them as standard stars for the Grasslands
data. This produced a V photometric zero point of 20.728 and a B photometric
zero point of 20.621. The instrumental magnitudes of the 524 stars measured
were corrected using an air mass correction in V of 0.12 magnitudes and B of
0.20 magnitudes based on the fact the Grasslands Observatory is at an altitude
of 5000 feet (~1525 meters) being not much lower than the altitude of Kitt Peak
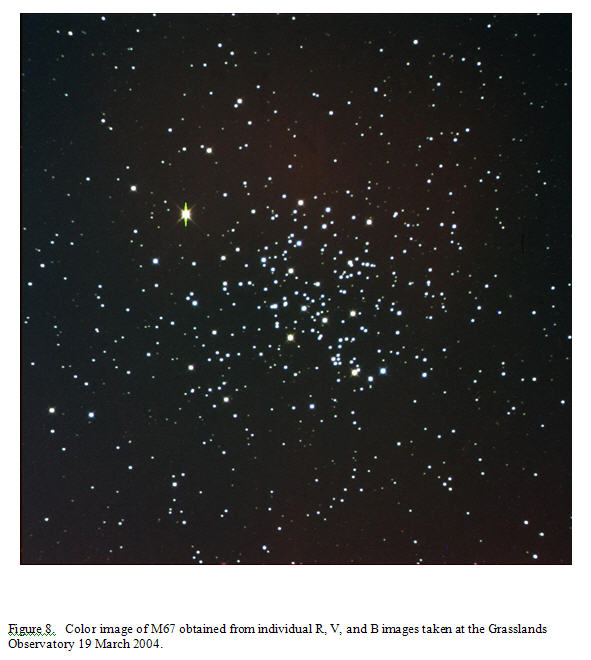
Observatory. Figure 8 shows a composite color image of M67 from the individual
V, B, and R images, and figure 9 shows a color magnitude diagram of V magnitude
versus B-V indices for the Grasslands data.
Back to Top
| Back to
Astrophotography
Discussion
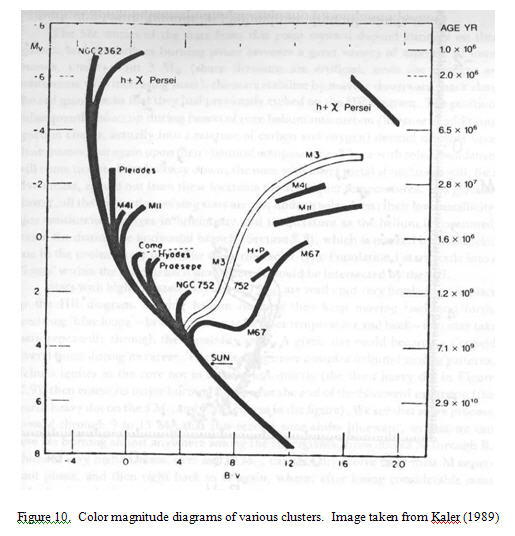
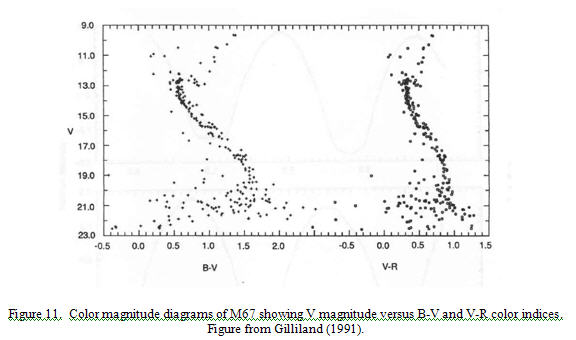
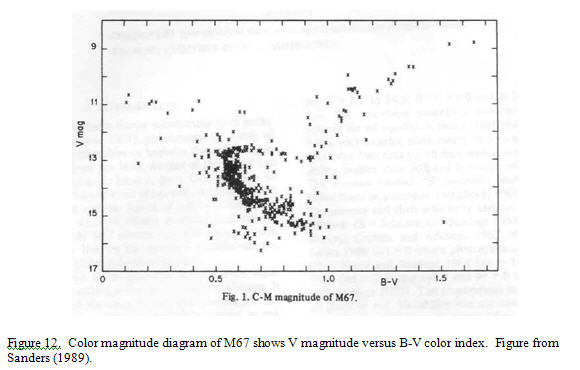
The color magnitude diagrams derived for M67 are in general agreement with
those published in the professional literature. Figures 10-12 show color
magnitude diagrams of M67 from three different professional sources:
M67 is an old cluster with many of its stars having left the main sequence.
Even the limited color magnitude diagrams produced for this project show a main
sequence turnoff and a giant branch. The lower end of the main sequence is not
shown in the 3towers data, but it is evident in the Grasslands data, though the
Grasslands data does not go nearly as faint as the data from Gilliland.
The color diagrams and the photometric values in this project are limited by
a number of factors. The main sequence is not well represented as there are too
few stars for a complete diagram. The effective limiting V magnitude for the
3towers Observatory data is 15, while many of the main sequence stars in M67 are
below this magnitude. Gilliland (1991), for example, plots stars down to 22nd
magnitude. The magnitude limitations herein are a reflection of the relatively
small size of the 3towers Observatory telescope, the relatively short exposure
times, and the limitations of the suburban skies (visual limiting magnitude
overhead 5.5) at the 3towers Observatory. The Grasslands Observatory data goes
fainter to magnitude 17, but its values are tied to those from the 3towers
Observatory as no Landolt Standard fields were taken with the Grasslands data.
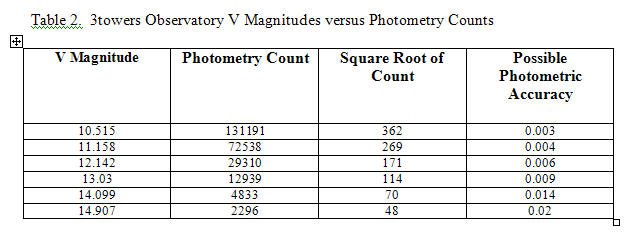
Table 2 shows the 3towers photometric V magnitude counts for selected stars
representing magnitudes 10.5-15. These demonstrate good counts for the brighter
stars, but it apparent that stars fainter than 14th magnitude suffer
from low counts, and their expected accuracy can not be better than 0.02
magnitudes.
Nevertheless, for 85 selected stars, the 3towers Observatory V magnitudes
differ from Sanders (1989) only by an average of 0.23 magnitudes. Sanders’
magnitudes are a combination of his own work and the work of others, some of
which includes photographic data. It should also be noted that there are seven
stars (Hunter #’s 21, 26, 46, 72, 87, 99, and 102) that differ from those of
Sanders by more than 0.5 magnitudes. The reason for this is unknown. It does
not seem to be correlated with the B-V indices of the individual stars. Stars
#72 (Sanders 963; GSC 814:2317) and #102 (Sanders 770; GSC 813:2212) differ from
Sanders’ results by more than a magnitude! Close inspection of the data images
obtained at the 3towers Observatory and the identification chart published by
Sanders in 1977 shows there was no misidentification of the two stars. Visual
inspection of the V image of M67 shows these two stars were definitely brighter
than the respective V magnitudes of 14.46 and 14.64 listed by Sanders. These
stars have respective B-V indices of 0.502 and 0.587 and are otherwise
unremarkable. They may have been mistakenly measured in the past, or they may
be variable stars. An interesting future project would be to monitor these and
other selected M67 stars for variability.
This project could have been improved by taking longer M67 data exposures and
by using data from the larger telescope at the Grasslands Observatory obtained
in a more systematic fashion with Landolt Standard fields. This would have
permitted photometry on fainter stars. The exposures were limited to 60-seconds
at the 3towers Observatory to insure there would be little guiding error. The
Meade LX-200 telescope at the 3towers Observatory does not have precise
tracking, and exposures longer than 60-seconds frequently show significant
trailing. Shorter exposures could have been added together, but this introduces
potential problems for data reduction and calibration with the Landolt Standard
field sequences. If longer exposures were to be used on either the 12-inch
Meade LX-200 telescope at the 3towers Observatory or the 24-inch f/5 telescope
at the Grasslands Observatory, the brightest stars in M67 would become
saturated. Thus, a wide range of photometric magnitude measurements for M67
requires a series of differing exposures for the cluster.
Another limitation of the project as presented herein lies in the lack of
thorough standardization of the 3towers Observatory telescope/CCD system with
the sky conditions and the lack of Landolt Standard fields for the Grasslands
Observatory data. One or more Landolt Standard fields should have been imaged
throughout the evening over a wide range of air masses from the Zenith, if
possible, to at least air mass 2 (Zenith Angle 600 ).
This would have insured much better air mass correction for the V, B, and R
sequences, and if the Landolt Standard field data had been examined as it was
obtained, the problem experienced with the B Standard field images as discussed
above might have been obviated. A future project for both observatories is to
perform such a standardization routine for one or more Landolt fields over a
sequence of two to three nights. This data could then be collated and serve as
a baseline for future photometric endeavors. Proper calibration of photometric
data with Landolt Standard fields that are imaged on the same night a data set
is taken will still be requisite for the most accurate photometry.
Two goals of this project were to produce a rough estimate for the distance
modulus of M67 and estimate M67’s age. Examination of the CMD’s for V versus
B-V (figures 5 and 6) show the main sequence turnoff point for the cluster
roughly occurs between V magnitudes 12.0-13.0 at a color index of 0.5-0.7. A
representative main sequence star in M67 near the turnoff point has a V
magnitude of 12.5 and a B-V index of 0.6. Such a star with a B-V color index of
0.58 is a G0 star with an absolute magnitude MV of 4.2 (Ostlie,
1996). If this star is representative of the top of the main sequence in M67,
then a calculated distance modulus of M67 is 12.5-4.2, or 8.3, which is
equivalent to a distance of 457 parsecs. Sandquist (2004) derived a distance
modulus for M67 of 9.72, and Sanders (1989) lists a distance modulus of 9.5.
The present estimate is off by more than a magnitude because of its very
simplistic approach, but it provides evidence that M67 is not nearby.
Estimating the age of M67 requires the use of sophisticated isochrones, an
endeavor beyond the scope of this project. Nevertheless, plunging ahead and
again using the purported G0 star at the top of the M67 main sequence, such is
star is noted to be slightly more massive than the Sun (Mstar/MassSun
= 1.05). It will have a slightly shorter life on the main sequence than
the Sun, whose lifespan on the main sequence is estimated to be 1010
years. The Sun is currently nearly 5 x 10⁹ years old. A G0 star
near the end of the main sequence should be at least this old. To be
conservative, an age of 5 billion years will be estimated for M67. This value
compares favorably with the most recent age estimates of M67 of 4-5 billions
years (Archinal, 2004; Sandquist, 2004). Previous professional estimates had
placed its age as somewhat greater. Clearly, M67 is quite old for an open
cluster. Its age is measured in gigayears, not in millions or hundreds of
millions of years.
Back to Top
| Back to
Astrophotography
Conclusion
The color magnitudes diagrams of M67 obtained for this project are limited
but are a reasonable representation of M67’s characteristics. They support the
widely held professional believe that M67 is an unusual very old open cluster.
Back to Top
| Back to
Astrophotography
References
Apogee Instruments, Inc., Auburn, CA.
Axiom Research, Tucson, AZ.
Archinal BA, Hynes SJ. Star Clusters. Willmann-Bell,
Inc., 2003, Richmond, VA.
Diffraction Ltd., Ottawa, ON, K2G 5W3, Canada.
Everett ME, Howell SB. A technique for ultrahigh-precision
CCD photometry. Pub Astron Soc Pac 2001; 113: 1428-1435.
Finger Lakes Instrumentation, LLC, Lima, NY 14485, USA.
http://www.fli-cam.com.
Gilliland RL, Brown TM, Duncan DK, Suntzeff NB, Lockwood GW,
Thompson DT, Schild RE, Jeffrey WA, Penprase BE. Time-resolved CCD photometry of
an ensemble of stars in the open cluster M67. Astron J 1991; 101, #2:
541-561.
Hunter TB. The 3towers Observatory:
http://www.3towers.com/3towersObserv.htm.
Hunter TB. The Grasslands Observatory:
http://www.3towers.com.
Kaler JB. Stars and Their Spectra. An Introduction to
the Spectral Sequence. Cambridge University Press, 1989, Cambridge, page
265.
Nissen PE, Twarog BA, Crawford DL. UvbyH-beta photometry of
main-sequence stars in M67. AA 1987: 93: 634-646.
Ostlie DA, Carroll BW. An Introduction to Modern Stellar
Astrophysics. Addison-Wesley Publishing Co., Inc., 1996, Reading, MA, pages
A13-14.
Romanishin W. An Introduction to Astronomical Photometry
Using CCDs. 2000, University of Oklahoma, Norman, OK.
Sanders WL. Membership of the open cluster M67. Astron
Astrophys Suppl 1977; 27: 89-116.
Sanders WL. UBV photometry of M67 members. Rev
Mexicana Astron Astrof 1989; 17: 31-35.
Sandquist EL. A high relative precision color-magnitude
diagram of M67. MNRAS 2004; 347: 101-118.
Smith PS. Standard star fields suitable for UBVRI
photometric calibration of the WIYN CCD imager. September 1998; at:
http://www.noao.edu/wiyn/obsprog/images/atlasinfo.html.
Walker EN. CCD photometry. at:
http://www.britastro.com/vss/ccd_photometry.htm.
Back to Top |
Back to
Astrophotography |

